Unlock a world of possibilities! Login now and discover the exclusive benefits awaiting you.
- Qlik Community
- :
- All Forums
- :
- QlikView App Dev
- :
- Re: About stack bar chart in Qlickview
- Subscribe to RSS Feed
- Mark Topic as New
- Mark Topic as Read
- Float this Topic for Current User
- Bookmark
- Subscribe
- Mute
- Printer Friendly Page
- Mark as New
- Bookmark
- Subscribe
- Mute
- Subscribe to RSS Feed
- Permalink
- Report Inappropriate Content
About stack bar chart in Qlickview
Hi everyone ,
,
I am a green hand of Qlikview, and dealing with a complex problem about seaport.
The stack bar chart I obtained now can be seen in attachment 1.
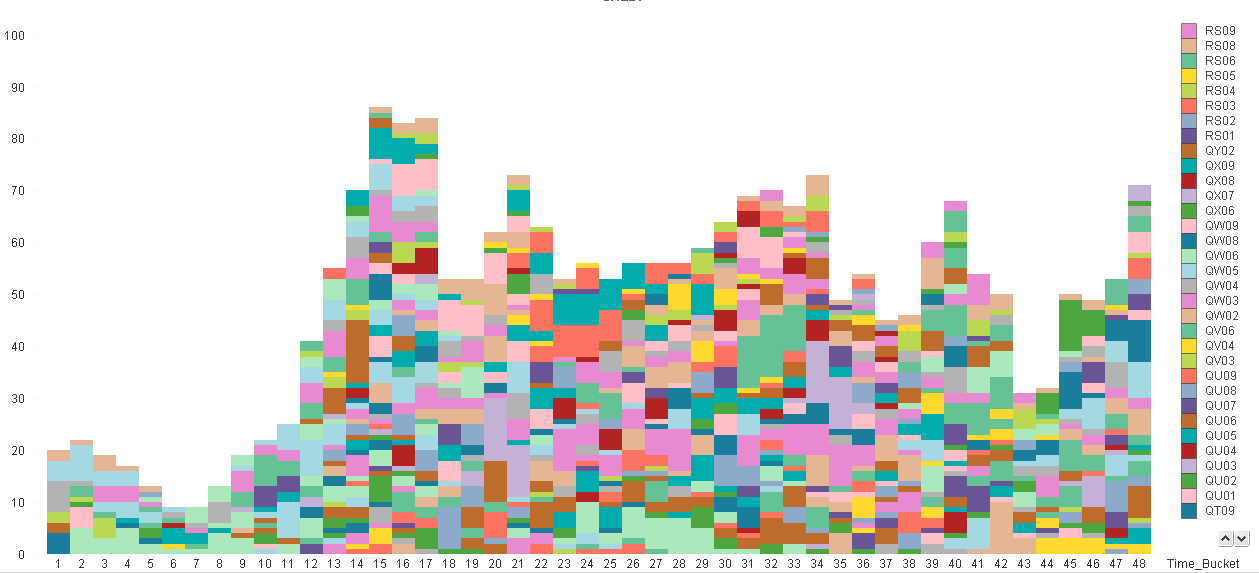
Since the no. of color in Qlik is limited to 18, and I have about 150 variables(such as RS09), so the colors are repeated. (Don't care about this, I will change it later)
The x-axle is time bucket, and y-axle is number. BTW, only part of the variables appear in one certain bar.
What I am trying to do are 2 pionts
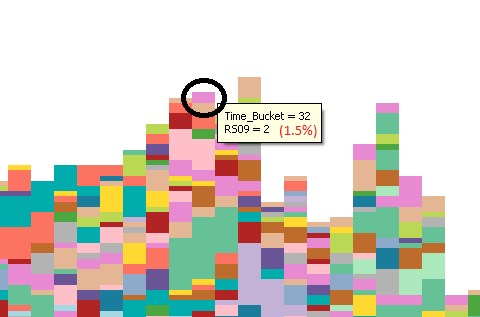
1 is to display both value & the each stack's percentage of each single bar (not the total number).
For example, for RS09 in Time_Bucket_32, shows Time_Bucket:32, RS09:2(1.5%) , like attachment 2.
2 is to display the pie chart of each bar when I move the mouse to the time bucket, which means I can display the main stack bar chart and the sub pie chart at the same time. I can only display the pie chart of each bar separately, can't link the pie charts to the main stack bar chart.
Anyone know what should I do to achieve the effects?
Would you please not give me the .qvw file since I don't have license to open it. Text or picture are best for me~
Thanks a looooooooooooooooot!
Best wishes,
Lyu Min
- Mark as New
- Bookmark
- Subscribe
- Mute
- Subscribe to RSS Feed
- Permalink
- Report Inappropriate Content
Hi,
you could add a second expression, uncheck the "Bar" display option, select "Text as Pop-up" and "Relative".
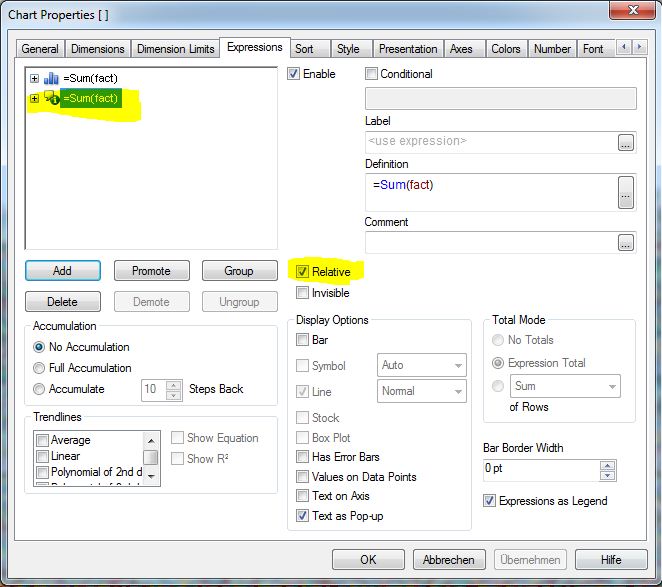
Hope this helps
regards
Marco
- Mark as New
- Bookmark
- Subscribe
- Mute
- Subscribe to RSS Feed
- Permalink
- Report Inappropriate Content
Hi Marco,
Thanks a lot Marco.
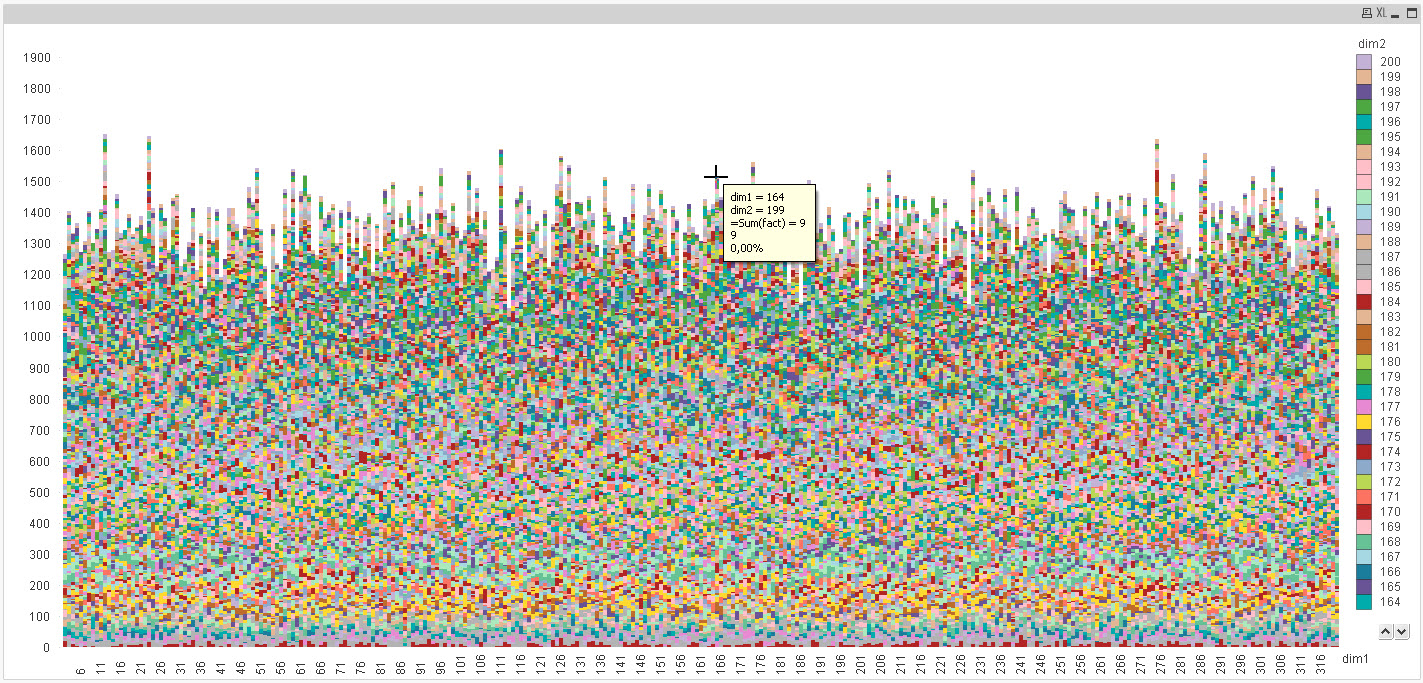
I tried as yours, the percentage can be displayed but the value of % is not correct, did not show the percentage of the stack of each bar. I only added KQ03 and PH03 to look the effect. (These two categories can be found in the lower right corner) .Would you please help me see what's wrong with it?
Thank you again.
Regards,
Lyu Min