Unlock a world of possibilities! Login now and discover the exclusive benefits awaiting you.
- Qlik Community
- :
- All Forums
- :
- QlikView App Dev
- :
- Re: Bar chart help
- Subscribe to RSS Feed
- Mark Topic as New
- Mark Topic as Read
- Float this Topic for Current User
- Bookmark
- Subscribe
- Mute
- Printer Friendly Page
- Mark as New
- Bookmark
- Subscribe
- Mute
- Subscribe to RSS Feed
- Permalink
- Report Inappropriate Content
Bar chart help
Hi Experts,
Can any one please help me on below issue.
I have a Avg Run time field in the source with hh:mm:ss format
In a bar chart i have taken Application as dimension and Sum(Avg_Runtime) as measure.
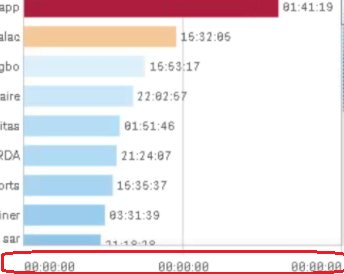
Here the datapoins getting correctly but in the scale its showing 00:00:00. How to convert the scale.
Please help me on this.
Thanks in advance.
- Mark as New
- Bookmark
- Subscribe
- Mute
- Subscribe to RSS Feed
- Permalink
- Report Inappropriate Content
After Sum give the format of output
- Mark as New
- Bookmark
- Subscribe
- Mute
- Subscribe to RSS Feed
- Permalink
- Report Inappropriate Content
I dont understand the chart. The numbers on the bars do not correspond with the size of the bars. Is the run time formatted as an Interval() or as a Time()? Perhaps this has something to do with the axis labels.
- Mark as New
- Bookmark
- Subscribe
- Mute
- Subscribe to RSS Feed
- Permalink
- Report Inappropriate Content
Hi,
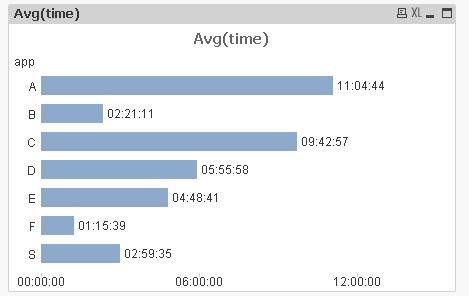
Set Number Format Setting as Time (HH:MM:SS).
following capture shows an expected output.