Unlock a world of possibilities! Login now and discover the exclusive benefits awaiting you.
- Qlik Community
- :
- All Forums
- :
- QlikView App Dev
- :
- Re: Calculating Relative % values for each X axis ...
- Subscribe to RSS Feed
- Mark Topic as New
- Mark Topic as Read
- Float this Topic for Current User
- Bookmark
- Subscribe
- Mute
- Printer Friendly Page
- Mark as New
- Bookmark
- Subscribe
- Mute
- Subscribe to RSS Feed
- Permalink
- Report Inappropriate Content
Calculating Relative % values for each X axis values
I have my Primary Dimension as Year and Product Category as my Secondary Dimension.
While calculating Sales %, I usually use Sum(Sales) with Relative option checked. If I do that, I get something like the below chart
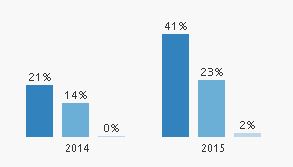
Here, the expression takes into account the values of all the 6 bars and then calculate a value. However, I need to get the relative split for each year. Something like this
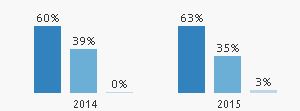
The above image has 2 Charts, one for 2014 and 2015. Is there a way to do it in a single chart?
Note: I don't want to use two expression in a single chart, because I want to make use of the Dimension selection option that is available by default and I have used this expression as Sum({1}Sales) since I have to highlight the selected Bar Chart and gray out the non selected something like this
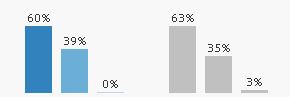
Even though these are all work around's for a particular problem. I'm curious enough to know Is it possible to implement all the above features in a single bar chart?
Accepted Solutions
- Mark as New
- Bookmark
- Subscribe
- Mute
- Subscribe to RSS Feed
- Permalink
- Report Inappropriate Content
Hi,
In expression, just give sum(Sales)/sum(TOTAL<year>Sales.
Thanks,
Vignesh U.
- Mark as New
- Bookmark
- Subscribe
- Mute
- Subscribe to RSS Feed
- Permalink
- Report Inappropriate Content
did u chkd option for all expressions?
relative
- Mark as New
- Bookmark
- Subscribe
- Mute
- Subscribe to RSS Feed
- Permalink
- Report Inappropriate Content
I just have a single expression. The three bars represent Secondary Dimension values. And, Yes. I checked the relative option
- Mark as New
- Bookmark
- Subscribe
- Mute
- Subscribe to RSS Feed
- Permalink
- Report Inappropriate Content
Try with
sum(Sales)/sum(Total <Year> Sales)
It should give you percentages per year
- Mark as New
- Bookmark
- Subscribe
- Mute
- Subscribe to RSS Feed
- Permalink
- Report Inappropriate Content
Hi,
In expression, just give sum(Sales)/sum(TOTAL<year>Sales.
Thanks,
Vignesh U.
- Mark as New
- Bookmark
- Subscribe
- Mute
- Subscribe to RSS Feed
- Permalink
- Report Inappropriate Content
And dont check the Relative checkbox in expression.