Unlock a world of possibilities! Login now and discover the exclusive benefits awaiting you.
- Qlik Community
- :
- All Forums
- :
- QlikView App Dev
- :
- Re: Conditional formatting
- Subscribe to RSS Feed
- Mark Topic as New
- Mark Topic as Read
- Float this Topic for Current User
- Bookmark
- Subscribe
- Mute
- Printer Friendly Page
- Mark as New
- Bookmark
- Subscribe
- Mute
- Subscribe to RSS Feed
- Permalink
- Report Inappropriate Content
Conditional formatting
Hi, is it possible to have multiple charts on a tab and have the max quarter (most recent quarter) show up in a different color
For example: 2010 Q1 -2011 Q4 (all bar charts would show up in blue) and then 2012 Q1 would be in green?
Thank you
- Tags:
- new_to_qlikview
- « Previous Replies
-
- 1
- 2
- Next Replies »
- Mark as New
- Bookmark
- Subscribe
- Mute
- Subscribe to RSS Feed
- Permalink
- Report Inappropriate Content
Hi garriguh,
Yes this is possible. Check out this video.
http://www.youtube.com/watch?v=0jCZPzh2ZAo
It should answer your question.
Regards,
Siz.
- Mark as New
- Bookmark
- Subscribe
- Mute
- Subscribe to RSS Feed
- Permalink
- Report Inappropriate Content
Hi G.
What you can use is:
if(Quarter =Max(Total Quarter), blue())
Use this as the background colour of your expression.
- Mark as New
- Bookmark
- Subscribe
- Mute
- Subscribe to RSS Feed
- Permalink
- Report Inappropriate Content
Hi< thank you for your help - but I'm think doing something wrong? Here's what my expression looks like:
=IF($(Time_Frame)=Max(=$(Time_Frame),blue(SUM([TOTAL REVENUE ($)]))/1000000
- Mark as New
- Bookmark
- Subscribe
- Mute
- Subscribe to RSS Feed
- Permalink
- Report Inappropriate Content
Hello garriguh,
I think there are two things to mention:
- the color of bars within a barchart can be changed using chart props --> expression tab --> expand the "+" of the corresponding expression --> use background color definition similar to:
if(Quarter= Max(TOTAL Quarter), Color(2))or
if(Quarter= MaxString(TOTAL Quarter), Color(2))
Which expr. will work in your case depends on the type of your period, being text or number
- in the expression definition itself use the sum() without any color, perhaps only a single sum(MyVal)/100000 or so.
Regards, Roland
- Mark as New
- Bookmark
- Subscribe
- Mute
- Subscribe to RSS Feed
- Permalink
- Report Inappropriate Content

Hi Roland - thank you - I'm still unable to get this to work for me :< I'm wondering if it's because I have Time_Frame set up as a variable so that when someone chooses Quarterly they get the quarterly view vs the annual?
- Mark as New
- Bookmark
- Subscribe
- Mute
- Subscribe to RSS Feed
- Permalink
- Report Inappropriate Content
OK,
first take a look at the sytnax error --> you are closing the if() too early with your first ")"
If Time_Frame is a name of a variable and of a field you have to use in case of the variable the corresponding syntax like:
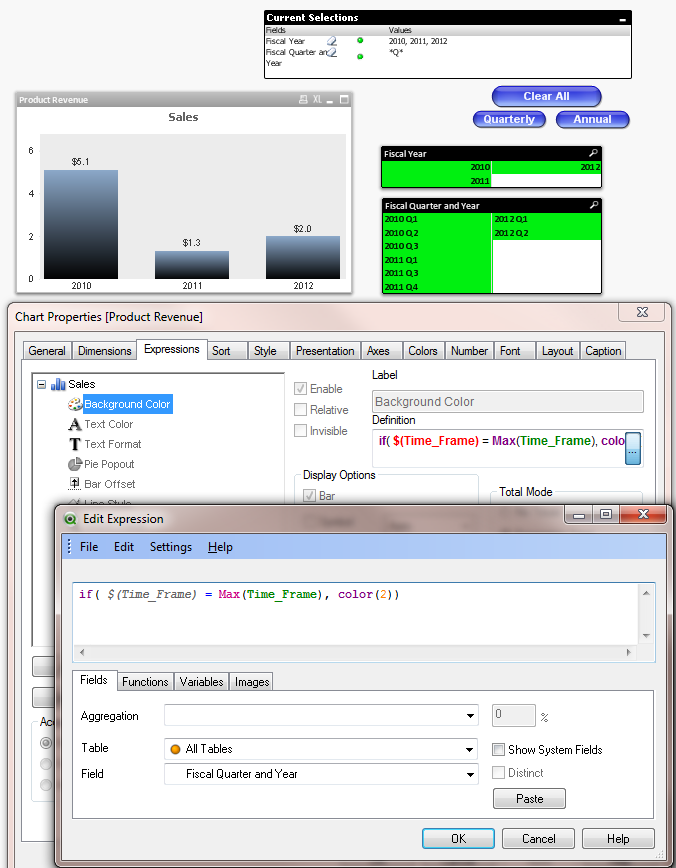
if( $(Time_Frame) = Max(Time_Frame), color(2))
BTW: it is a good habit to let variablenames start with a "v" to see it is a variable and not a field. Play around if you need the TOTAL or not.
HtH
Roland
- Mark as New
- Bookmark
- Subscribe
- Mute
- Subscribe to RSS Feed
- Permalink
- Report Inappropriate Content
Hi Roland, Thank you for your help, but I still seem to be missing something. No matter what I try and if I had total it still doesn't display my chart with a different color for max date?
- Mark as New
- Bookmark
- Subscribe
- Mute
- Subscribe to RSS Feed
- Permalink
- Report Inappropriate Content
Are your sales in the charts shown per Year or per Quarter?
- Mark as New
- Bookmark
- Subscribe
- Mute
- Subscribe to RSS Feed
- Permalink
- Report Inappropriate Content
they are shown both ways depending on which button they choose (Annual) or (Quarterly) which is driven by the variable (Time_Frame)
- « Previous Replies
-
- 1
- 2
- Next Replies »