Unlock a world of possibilities! Login now and discover the exclusive benefits awaiting you.
- Qlik Community
- :
- All Forums
- :
- QlikView App Dev
- :
- Create sub totals
- Subscribe to RSS Feed
- Mark Topic as New
- Mark Topic as Read
- Float this Topic for Current User
- Bookmark
- Subscribe
- Mute
- Printer Friendly Page
- Mark as New
- Bookmark
- Subscribe
- Mute
- Subscribe to RSS Feed
- Permalink
- Report Inappropriate Content
Create sub totals
Hello,
please find attached the following figure:
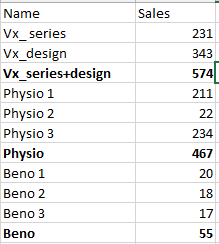
I want to know if it is possible to create sub totals (bolt lines) like mentioned in the figure.
Please give me a general idea because the figure showed an easy example and the realtiy is more difficult.
Please note that i am using QlikView 11.
Thank you,
Alâa Eddine.
- Mark as New
- Bookmark
- Subscribe
- Mute
- Subscribe to RSS Feed
- Permalink
- Report Inappropriate Content
Can you provide a sample data?
- Mark as New
- Bookmark
- Subscribe
- Mute
- Subscribe to RSS Feed
- Permalink
- Report Inappropriate Content
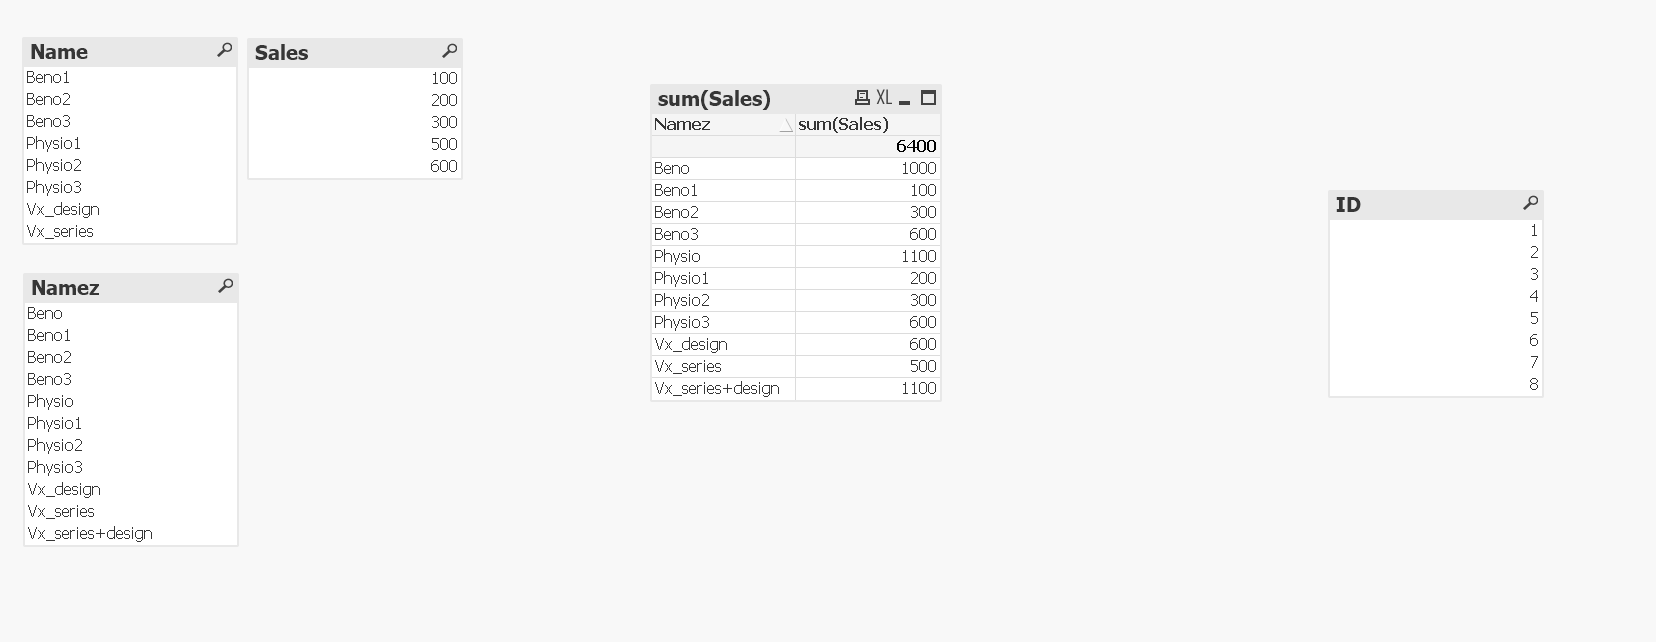
My approach may not make sense since I'm using CrossTable which would generate duplicates sometimes but I can only think of this solution...
Temp:
LOAD * INLINE [
Name, Sales
Vx_series, 500
Vx_design, 600
Physio1, 200
Physio2, 300
Physio3, 600
Beno1, 100
Beno2, 300
Beno3, 600
];
Temp2:
CrossTable (Temp,Namez,3)
Load *,
RecNo() as ID,
Name as Names,
if( WildMatch(Name,'Vx_*')>0,'Vx_series+design') as VxSD,
if( WildMatch(Name,'Ph*')>0,'Physio') as Physio,
if( WildMatch(Name,'Be*')>0,'Beno') as Beno
Resident Temp;
Drop Table Temp;
- Mark as New
- Bookmark
- Subscribe
- Mute
- Subscribe to RSS Feed
- Permalink
- Report Inappropriate Content
Can you try this:
Temp:
LOAD * INLINE [
Name, Sales
Vx_series, 500
Vx_design, 600];
Concatenate
load
'Vx_series+design' as Name,
sum(Sales) as Sales
Resident Temp
where WildMatch(Name,'Vx_*')
group by Name;
Concatenate:
LOAD * INLINE [
Name, Sales
Physio1, 200
Physio2, 300
Physio3, 600
];
Concatenate
load
'Physio' as Name,
sum(Sales) as Sales
Resident Temp
where WildMatch(Name,'Ph*')
group by Name;
Concatenate:
LOAD * INLINE [
Name, Sales
Beno1, 100
Beno2, 300
Beno3, 600
];
Concatenate
load @
'Beno' as Name,
sum(Sales) as Sales
Resident Temp
where WildMatch(Name,'Be*')
group by Name;
 ;
;
- Mark as New
- Bookmark
- Subscribe
- Mute
- Subscribe to RSS Feed
- Permalink
- Report Inappropriate Content
Hi Alaa,
One more possible way:
Create a inline table or a excel based mapping based on your convience:
MapTable:
Load * Inline [
NewName, Name
Vx_series, Vx_serie
Vx_design, Vx_design
Vx_series+design, Vx_serie
Vx_series+design, Vx_design
Physio1, Physio1
Physio2, Physio2
Physio3, Physio3
Physio, Physio1
Physio, Physio2
Physio, Physio3
];
Now use 'NewName' field in your straight chart.
Exp: Sum(Sales)
Br,
KC
KC
- Mark as New
- Bookmark
- Subscribe
- Mute
- Subscribe to RSS Feed
- Permalink
- Report Inappropriate Content
Why not simply Partial Sum option in Pivot Table?
- Mark as New
- Bookmark
- Subscribe
- Mute
- Subscribe to RSS Feed
- Permalink
- Report Inappropriate Content
Hello,
how can i do it please?
Best regards,
Alâa Eddine.
- Mark as New
- Bookmark
- Subscribe
- Mute
- Subscribe to RSS Feed
- Permalink
- Report Inappropriate Content
Hi,
Please see the below video it will help you.
https://www.youtube.com/watch?v=5eMV5NQY-5g
Regards,
Vinod
- Mark as New
- Bookmark
- Subscribe
- Mute
- Subscribe to RSS Feed
- Permalink
- Report Inappropriate Content
There are two simple ways to solve your problem.
1. Use an pivot table instead of an straight table. @vinod22kv youtube link will show you how to do it.
2. Create sub totals in a straight table by the dimension limits-feature in the chart properties. This link will guide you: Sub totals in a qlik straight table #theSuperEasyQlikViewMethod
Qlik Community MVP