Unlock a world of possibilities! Login now and discover the exclusive benefits awaiting you.
- Qlik Community
- :
- All Forums
- :
- QlikView App Dev
- :
- Re: DrillThrough
- Subscribe to RSS Feed
- Mark Topic as New
- Mark Topic as Read
- Float this Topic for Current User
- Bookmark
- Subscribe
- Mute
- Printer Friendly Page
- Mark as New
- Bookmark
- Subscribe
- Mute
- Subscribe to RSS Feed
- Permalink
- Report Inappropriate Content
DrillThrough posible?
Hello QlikView comunity,
I'm very new in QlikView and made my first steps to create complex reports discribed here in the comunity.
First report with dynamical dimensions has been implemented successfully. Many thanks for this.
But what I can not found is a description for drill through. Please no Drill Down.
A have a table and clicking on one cell should shown an additional table with data for this cell.
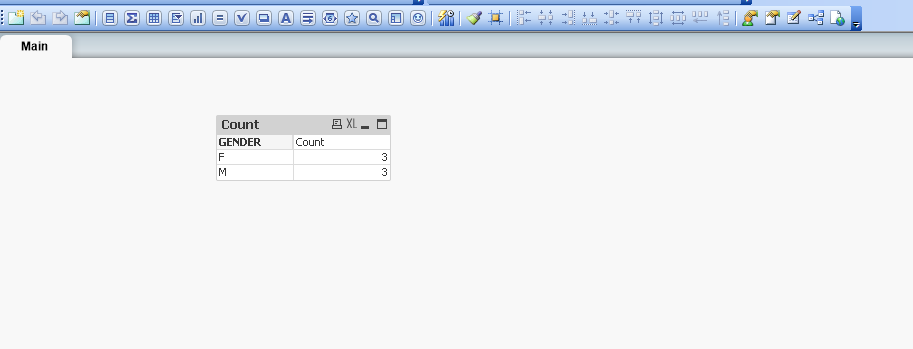
e.g.
Gender Count
W 1
M 3
If I'm clicking e.g. 3 at the table cell and data like this should be shown:
First name/ Last name/age
A/B/12
C/B/24
D/T/70
Could I get an description/exple?
Many thanks
- Mark as New
- Bookmark
- Subscribe
- Mute
- Subscribe to RSS Feed
- Permalink
- Report Inappropriate Content
Hello experts,
any ideas?
Thanks
- Mark as New
- Bookmark
- Subscribe
- Mute
- Subscribe to RSS Feed
- Permalink
- Report Inappropriate Content
Hi,
Please find attached the solution Qvw for your reference.
please let me know in case any query
Regards,
Bhasker Kumar
- Mark as New
- Bookmark
- Subscribe
- Mute
- Subscribe to RSS Feed
- Permalink
- Report Inappropriate Content
Hello,
thanks a lot for your solution.
I'm using the Version QlikView 12.20.20400.0 and can not open your example. Could you descibe it please? Or send me a version a will be able to open?
Many thanks
Alex
- Mark as New
- Bookmark
- Subscribe
- Mute
- Subscribe to RSS Feed
- Permalink
- Report Inappropriate Content
Hi,
please find below descriptions.
1. i have combined the required fields :-
** ******************Script Start*****
// Loading Sample data
Data:
Load * Inline [
GENDER, Firstname, Lastname, age
M, A, B, 12
M, C, B, 24
M, D, T, 70
F, E, G, 34
F, J, K, 25
F, Z, X, 26
];
Test1:
LOAD
GENDER,
GENDER&'/'&Firstname&'/'&Lastname&'/'&age as Combine // combining required fields
Resident Data;
DROP Table Data;
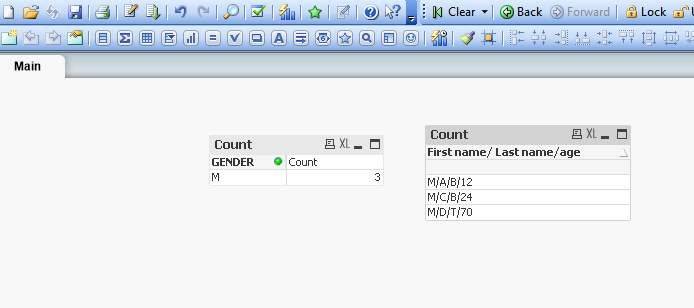
2. On front end i have used two pivot table and conditional show hide- based on the selections.
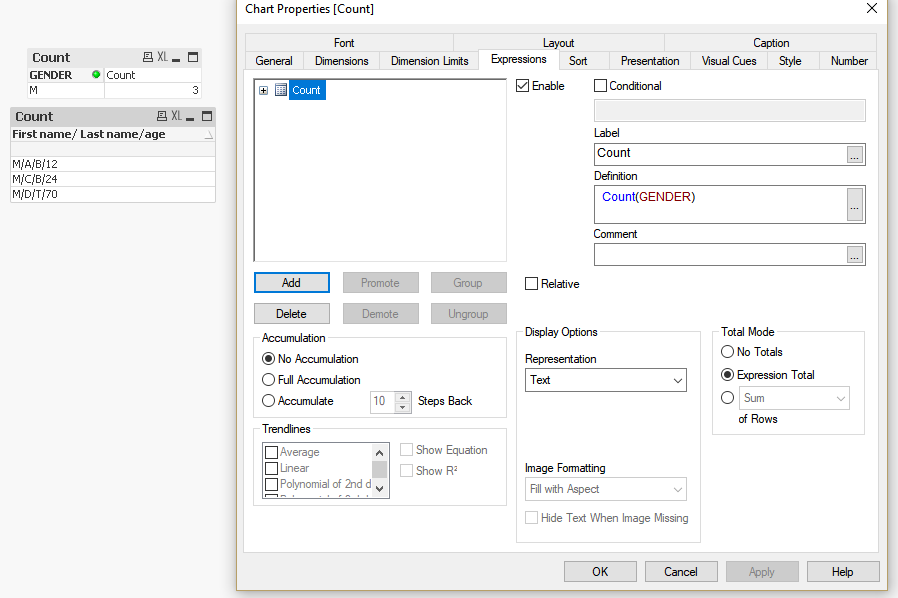
2.1-> on First table i have simply took Gender as Dimension and Count of Gender(Count(GENDER) as Expression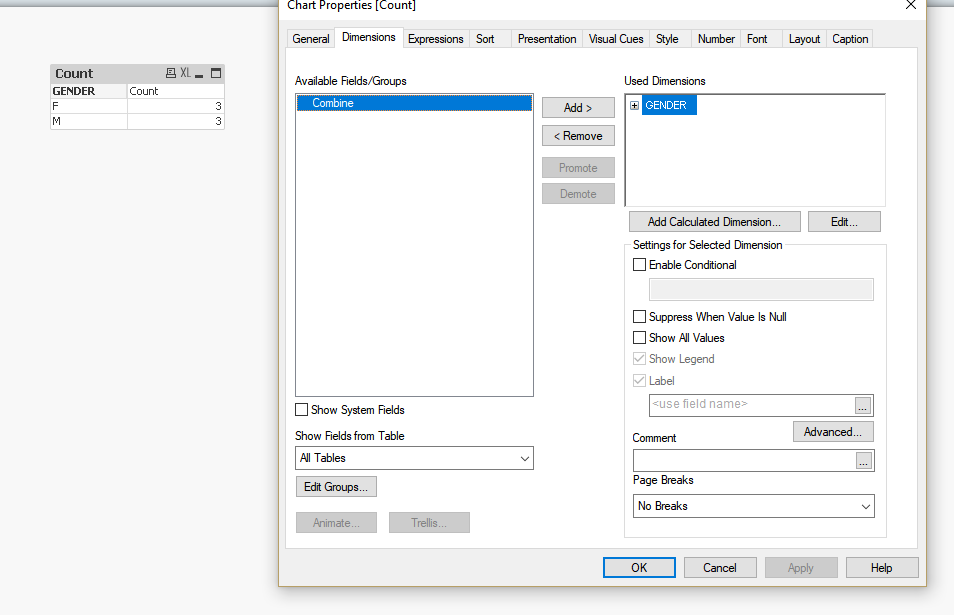
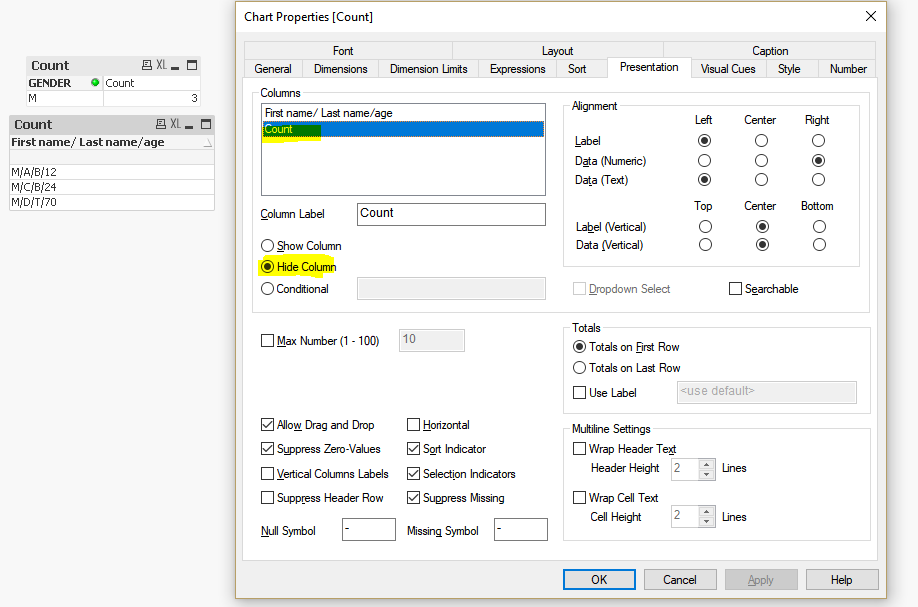
2.2 on second table i have used Combine field as dimension and Count(GENDER) as Expression.
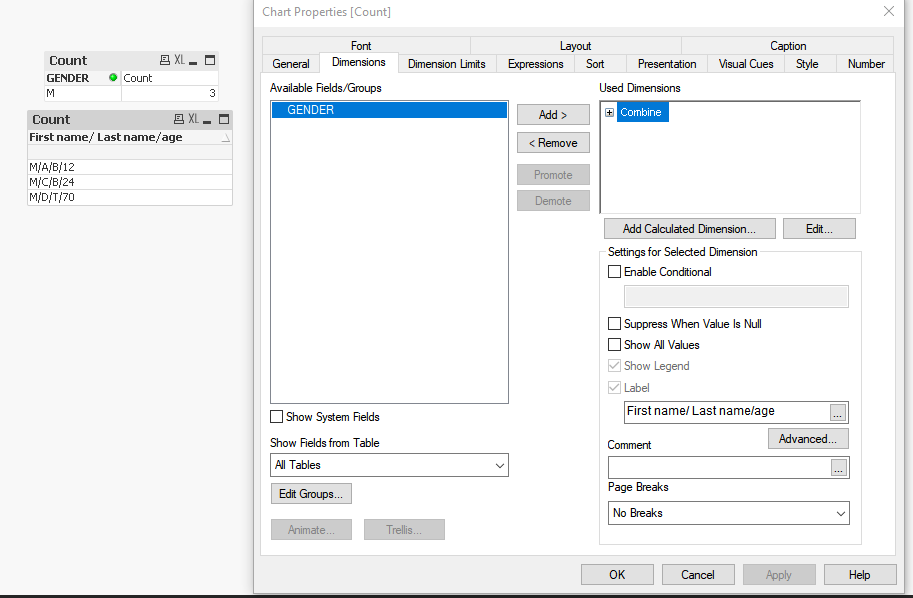
2.3 i have used show hide chart condition based on the selection of GENDER
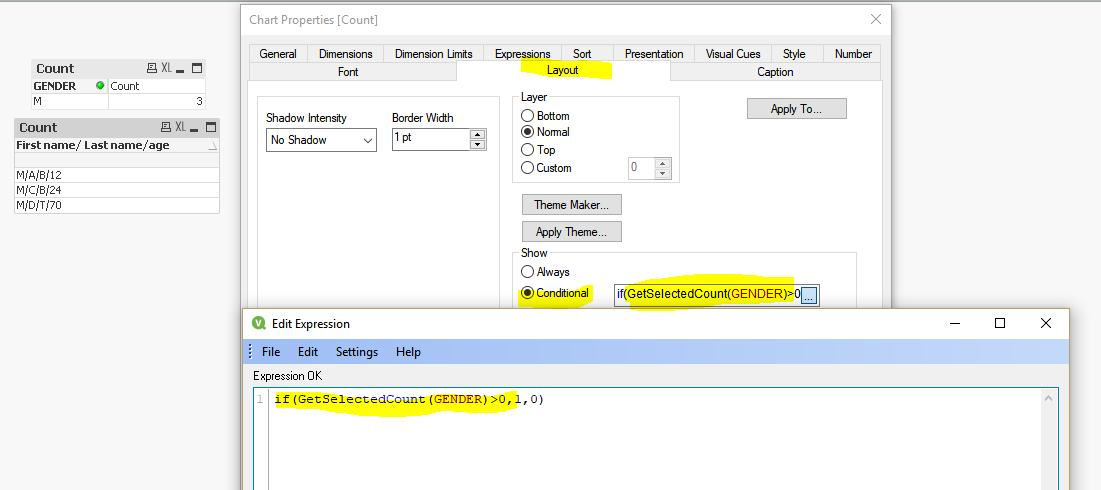
2.4 At last i have hide the expression by using Hide Column option under Presentation Tab
Please let me know in case any query.
Regards,
Bhasker