Unlock a world of possibilities! Login now and discover the exclusive benefits awaiting you.
- Qlik Community
- :
- All Forums
- :
- QlikView App Dev
- :
- Dynamic Data
- Subscribe to RSS Feed
- Mark Topic as New
- Mark Topic as Read
- Float this Topic for Current User
- Bookmark
- Subscribe
- Mute
- Printer Friendly Page
- Mark as New
- Bookmark
- Subscribe
- Mute
- Subscribe to RSS Feed
- Permalink
- Report Inappropriate Content
Dynamic Data
I'm getting the first January chart Bar from an excel sheet (named Jan.xlsx) cell value.
Is it possible to make a QlikView report in a way that if I copy a new excel sheet (named Apr.xlsx) to the report directory, it automatically fetches the cell value and and creates a new chart bar for April?
Thanks,
Miguel
- Mark as New
- Bookmark
- Subscribe
- Mute
- Subscribe to RSS Feed
- Permalink
- Report Inappropriate Content
Hi,
you have to loop the directory, like this
Directory;
for each v_Path in 2011,2012,2013
SET v_FileFilter='*.xls';
for each File in filelist('$(v_Path)'&'\'&right('$(v_Path)',2)&'$(v_FileFilter)')
Load ....
next File
next v_Path
- Mark as New
- Bookmark
- Subscribe
- Mute
- Subscribe to RSS Feed
- Permalink
- Report Inappropriate Content
Hi Miguel,
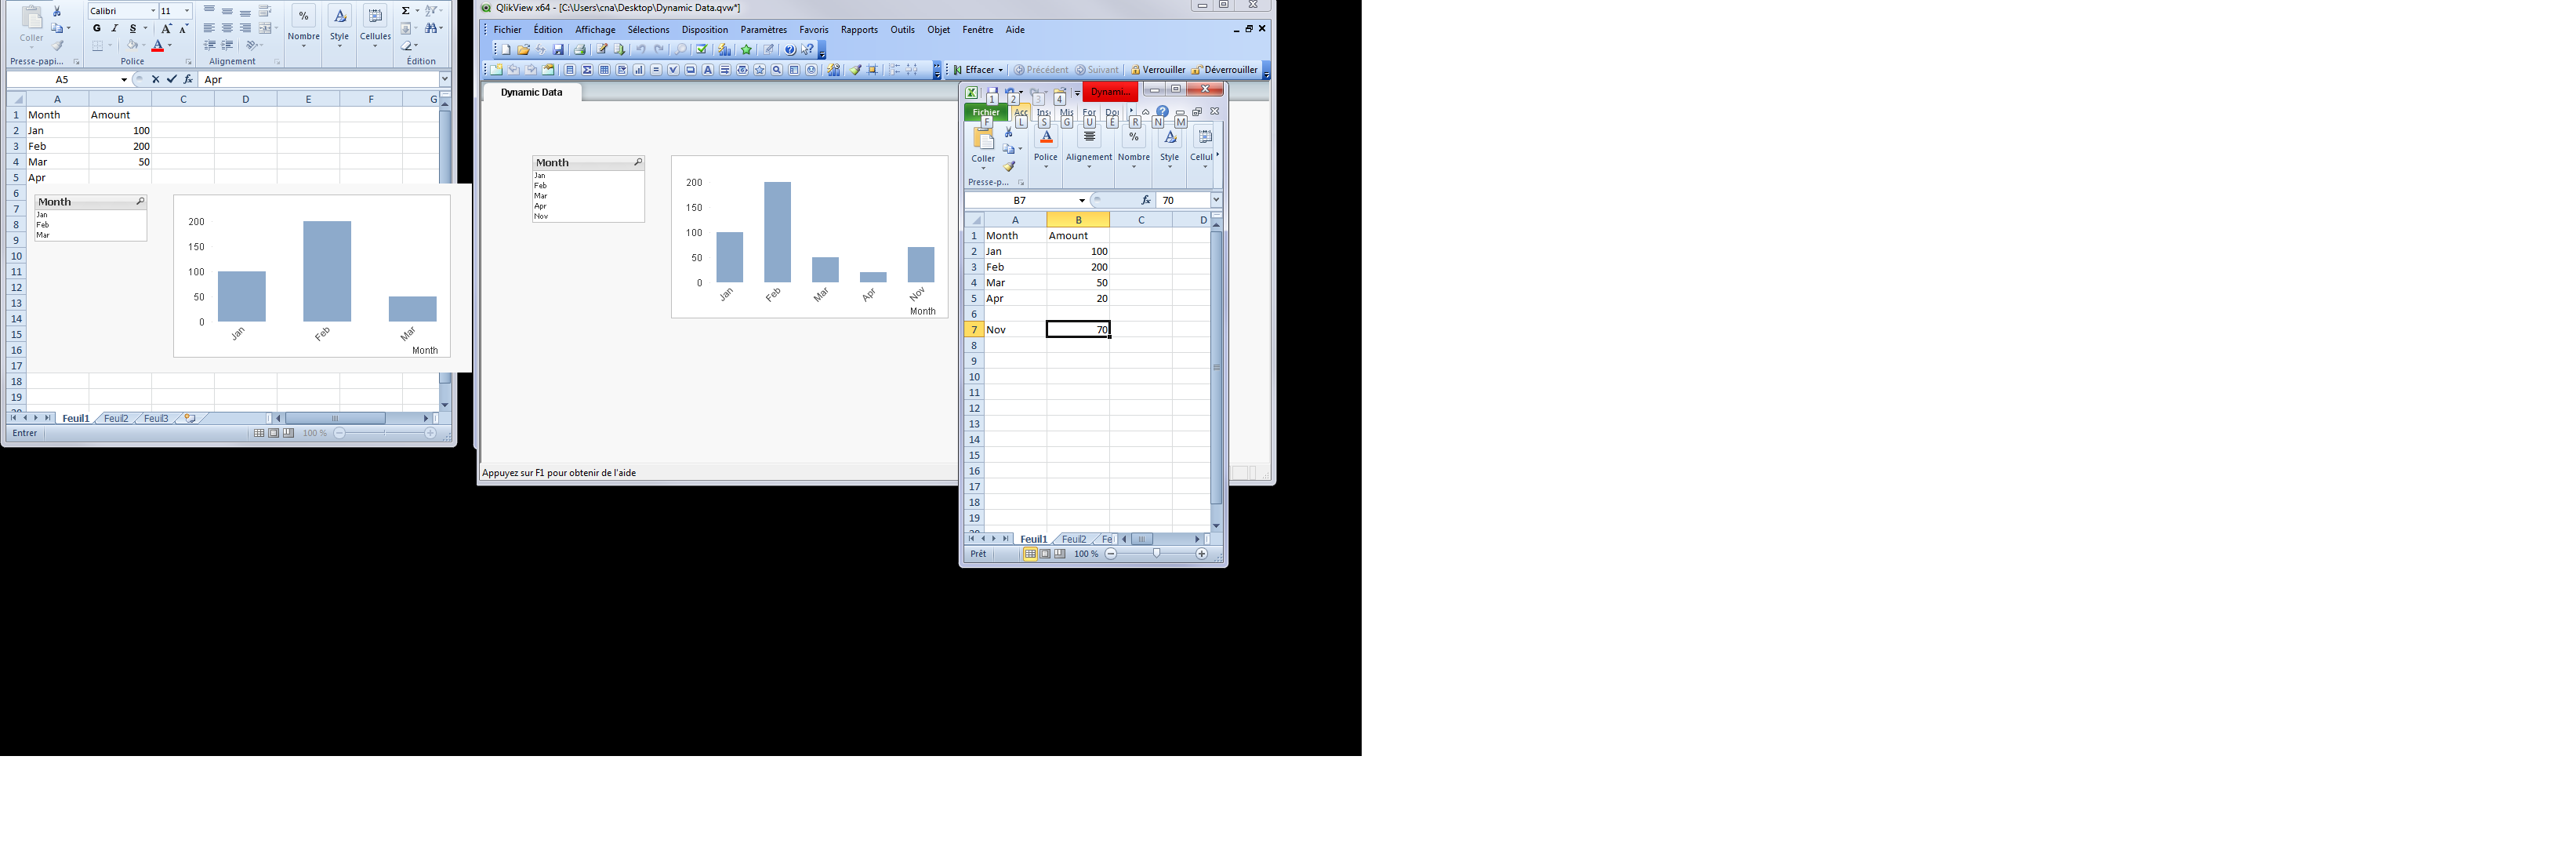
I create axls File : dynamic Data.xls
| Month | Amount |
| Jan | 100 |
| Feb | 200 |
| Mar | 50 |
I create a qvw  ynamic Data.qvw
The script :
LOAD
Month,
Amount
FROM [Dynamic Data.xlsx] (ooxml, embedded labels, table is Feuil1);
Dimension : Month
Expression : Match(
Month,'Jan','Feb','Mar','Apr','May','Jun','Jul','Aug','Sept','Oct','Nov','Dec'),
sum(Amount),
sum(Amount),
sum(Amount),
sum(Amount),
sum(Amount),
sum(Amount),
sum(Amount),
sum(Amount),
sum(Amount),
sum(Amount),
sum(Amount),
sum(Amount)
)
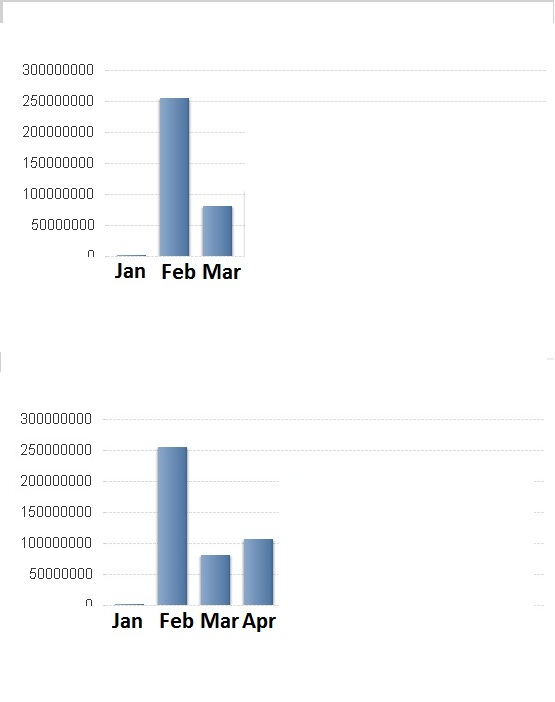
By defalut you have 3 months qith values. If you add one or 2 others Months, the bar bart dynamically update.
Sorry I don't know where I can put my sample.
Hope this helps.
- Mark as New
- Bookmark
- Subscribe
- Mute
- Subscribe to RSS Feed
- Permalink
- Report Inappropriate Content
I'll post here some samples because Judikael tried to help, but he didn't understand the question.
I'll keep you posted.
Thanks.