Unlock a world of possibilities! Login now and discover the exclusive benefits awaiting you.
- Qlik Community
- :
- All Forums
- :
- QlikView App Dev
- :
- Help for a QlikView newbie....
- Subscribe to RSS Feed
- Mark Topic as New
- Mark Topic as Read
- Float this Topic for Current User
- Bookmark
- Subscribe
- Mute
- Printer Friendly Page
- Mark as New
- Bookmark
- Subscribe
- Mute
- Subscribe to RSS Feed
- Permalink
- Report Inappropriate Content
Help for a QlikView newbie....
I'm trying to manipulate some data and having a little bit of trouble. I currently have data with several columns, including region (Europe, Asia....etc), question and answer (1 through 5).
What I'm trying to do is get the average answer for all questions from a given region. For instance, I want to get an average of the ansers for every question in our 'Europe' region. Can anybody point me in the correct direction on how to do this? I wanted to create a gauge chart to display the average, but having issues just getting started.
Thanks in advance,
Tim
- « Previous Replies
-
- 1
- 2
- Next Replies »
Accepted Solutions
- Mark as New
- Bookmark
- Subscribe
- Mute
- Subscribe to RSS Feed
- Permalink
- Report Inappropriate Content
OK - so you are looking to have multiple gauges, one for each continent?
You can add the continent to the set analysis like so:
count({<Answer = {'Satisfied'},Continent = {'Asia'}>}Distinct Question)
/
count({<Continent = {'Asia'}>}Distinct Question)
As an alternative, you can simply use "count({<answer = {'Satisfied'}>}Distinct Question) / count(Distinct Question)" I suggested in a heavily formatted bar chart. See Attached !
- Mark as New
- Bookmark
- Subscribe
- Mute
- Subscribe to RSS Feed
- Permalink
- Report Inappropriate Content
Hi,
Can you post some sample data?
Thanks
- Mark as New
- Bookmark
- Subscribe
- Mute
- Subscribe to RSS Feed
- Permalink
- Report Inappropriate Content
So I guess you would want a single gauge chart for each country?
You can create a guage chart with country as your dimension and then use Avg(Answer) as expression and then use trellis option to see a gauge chart for each country.
I hope that make sense.
Best,
Sunny
- Mark as New
- Bookmark
- Subscribe
- Mute
- Subscribe to RSS Feed
- Permalink
- Report Inappropriate Content
How many columns you want to show?
Provide a picture of what you are expecting.
Regards,
Anjali Gupta
- Mark as New
- Bookmark
- Subscribe
- Mute
- Subscribe to RSS Feed
- Permalink
- Report Inappropriate Content
Thanks Sunny (and everybody else!) I did set up my Region (country) as the dimension, so at least I was on the right path 
What I need to show is the percentage of the answers that are equal to a value -- in this case, "Satisfied". So I need to find out what percentage of the total number of answers for a Country were reported as "Satisfied". Can I still do that with just Avg?
- Mark as New
- Bookmark
- Subscribe
- Mute
- Subscribe to RSS Feed
- Permalink
- Report Inappropriate Content
| Satisfied | 201405013 | English | GroupAudioConfExternal | Asia | 3278213832 | SBU3 |
| Satisfied | 201405013 | English | GroupAudioConfExternal | Asia | 3286480866 | SBU1 |
| Satisfied | 201405013 | English | SelfVideoConferencing | Asia | 3278213832 | SBU3 |
| Satisfied | 201405013 | English | SelfVideoConferencing | Asia | 3286480866 | SBU1 |
| Doesnt Meet Needs | 18698416 | English | GroupAudioConfExternal | Asia | 3534764509 | SBU2 |
| Doesnt Meet Needs | 18698416 | English | GroupAudioConfExternal | Asia | 3536532925 | SBU1 |
- Mark as New
- Bookmark
- Subscribe
- Mute
- Subscribe to RSS Feed
- Permalink
- Report Inappropriate Content
Hello Timothy,
You can accomplish this with set analysis:
assuming fields = answer and ID
count({<answer = {'Satisfied'}>}Distinct ID) / count(Distinct ID)
This will give you percentage of Satisfied vs. Total
- Mark as New
- Bookmark
- Subscribe
- Mute
- Subscribe to RSS Feed
- Permalink
- Report Inappropriate Content
Hi,
another solution could be to use the display option "circular gauge" in a pivot table:
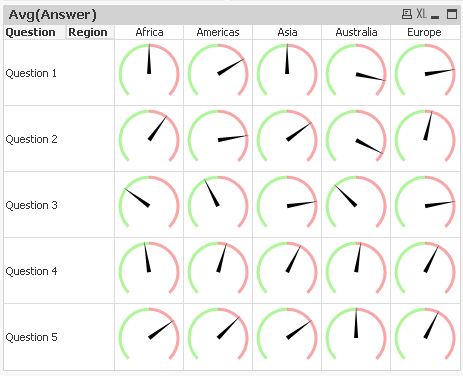
hope this helps
regards
Marco
- Mark as New
- Bookmark
- Subscribe
- Mute
- Subscribe to RSS Feed
- Permalink
- Report Inappropriate Content
Have a look to this blog
- Mark as New
- Bookmark
- Subscribe
- Mute
- Subscribe to RSS Feed
- Permalink
- Report Inappropriate Content
Hi David,
Thanks for the reply. I think you've pointed me in the right direction, but I'm worried that my needs might be a little bit more complex (I hope not). So I do have the "Answer" field, and instead of ID, I think I can use "Question" (there are multiple questions that each user has to answer). But I want to make sure that I'm only counting the answers that are coming from the Asia region (for this example).
So I need the number of "Satisfied" responses from all users for all questions from the Asia region divided by the total number of questions that were answered in the Asia region.
Does what I'm trying to do make sense?
Thanks again for all of the help so far.
Tim
- « Previous Replies
-
- 1
- 2
- Next Replies »