Unlock a world of possibilities! Login now and discover the exclusive benefits awaiting you.
- Qlik Community
- :
- All Forums
- :
- QlikView App Dev
- :
- Help with bar chart!
- Subscribe to RSS Feed
- Mark Topic as New
- Mark Topic as Read
- Float this Topic for Current User
- Bookmark
- Subscribe
- Mute
- Printer Friendly Page
- Mark as New
- Bookmark
- Subscribe
- Mute
- Subscribe to RSS Feed
- Permalink
- Report Inappropriate Content
Help with bar chart!
Good Morning.
I´m new to Qlikview and I want to ask you some questiones.
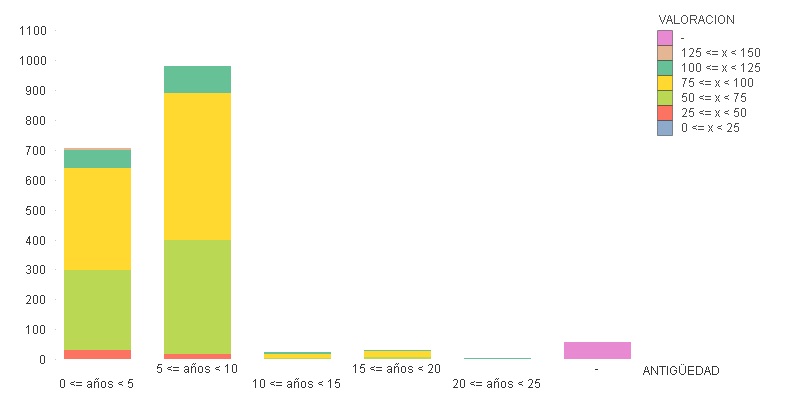
I have a chart with some employees (empl), their labor seniority (años) and their personal evaluation (punt).
I want to make a bar chart with the labor seniority in the x axis in groups of 5 years (I´ve made it with the class funtion) .
Furthermore, every bar must show (stacked) the % of employees that are inside a certain group of evaluation(for example in groups of 50).
I show you my job. A hyphen appears when the data exceed a certain value, both in seniority and evaluation (dimensions).
Also I need tha all the bars have the same lenght regardless of the number of employees that would be in every group of evaluation.
Thank you very much for your help.
- Mark as New
- Bookmark
- Subscribe
- Mute
- Subscribe to RSS Feed
- Permalink
- Report Inappropriate Content
I don't think that this will be possible and which sense would it make if all bars showed the same? I believe you will rather need other ways to visualize your requirements and to use two or several (simple) charts for one visualization-aim might be better then to build rather complex visualizations.
- Marcus