Unlock a world of possibilities! Login now and discover the exclusive benefits awaiting you.
- Qlik Community
- :
- All Forums
- :
- QlikView App Dev
- :
- Re: How can i show different scale (site, region, ...
- Subscribe to RSS Feed
- Mark Topic as New
- Mark Topic as Read
- Float this Topic for Current User
- Bookmark
- Subscribe
- Mute
- Printer Friendly Page
- Mark as New
- Bookmark
- Subscribe
- Mute
- Subscribe to RSS Feed
- Permalink
- Report Inappropriate Content
How can i show different scale (site, region, country) for one expression (average) ?
Hello the community,
Can someone help me?
I'm beginner in data visualization and have to creat a board.
I have a dataset with some quantitative variables like sodium or nickel concentration
and some qualitative variables to qualify each sampling point like the site, the city, the region, the country....
I want to create a histogram that will show me
*the value of sodium for my sampling point
AND
*the average for the site, the city the region, the country.
That would permit me to compare my valor on one point on different scales around this point.
The best will be if i can add on my representation my allowed limit for the tested constituant (maximum level accepted) but this is not the most important topic here.
I inserted an exemple made by Excel of what i search to do with Qlik View 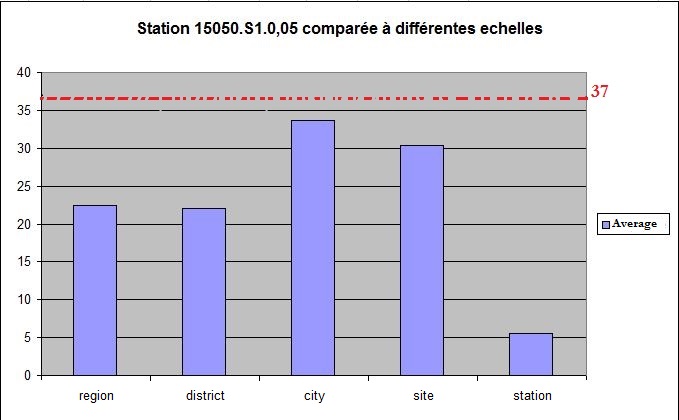
I hope to not bothering everybody too long for my questions.
Thank you
Kind regards
Morgane
- Mark as New
- Bookmark
- Subscribe
- Mute
- Subscribe to RSS Feed
- Permalink
- Report Inappropriate Content
Refer Recipe for a Histogram and How to do a histogram?
Siva
- Mark as New
- Bookmark
- Subscribe
- Mute
- Subscribe to RSS Feed
- Permalink
- Report Inappropriate Content
Sorry, I was maybe confused on my topic....I don't want to do a Histogram but a Barplot. I don't search to show the frequencies and the repartition but the level of a composant at different geographic levels.
I know how to do a histogram and i looked the two links you shown me (and thank to give them to me so i will never search for them again if i have a problem) but it's not exacly my goal.
What I want to have is the average for a site and the average for the district where is the site and again with the region.
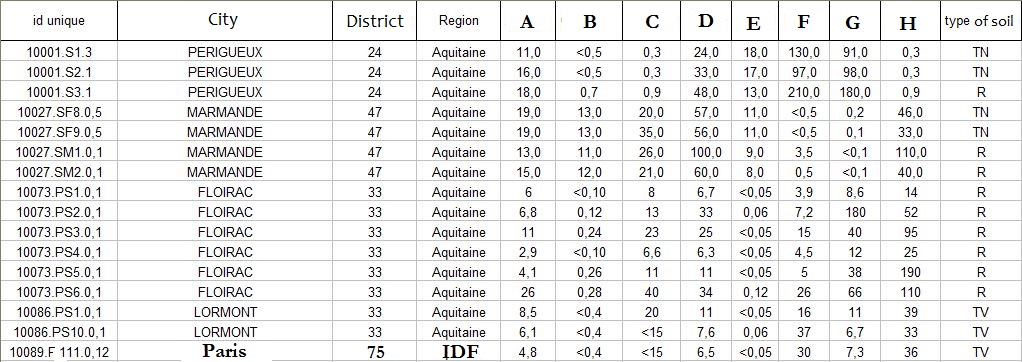
i have a sample of my dataset to show
if i select the sample point "10086.PS1.0.1" and i want to show the different levels of the componant "D"
i will have one bar: = value of "D" for "10086.PS1.0.1" = 11
one bar = avg (10086) = (11+7.6)/2 = 9.3
one bar = avg ("lormont") = (11+7.6)/2 = 9.3
one bar = avg ("33") = 16.83
and finally one bar = avg ("Aquitaine") = 34.2
I hope not missing something and not being bothering you?
- Mark as New
- Bookmark
- Subscribe
- Mute
- Subscribe to RSS Feed
- Permalink
- Report Inappropriate Content
Hi,
this can be probably useful too:
Histogram example
- Mark as New
- Bookmark
- Subscribe
- Mute
- Subscribe to RSS Feed
- Permalink
- Report Inappropriate Content
I am sorry but i don't find the solution in your answers.
I found how to show the repartition's frequencies but not what i'm asking for.
Thank you Vincenza and siva for your answer but i think i need a more developed one to understand.
Morgane
- Mark as New
- Bookmark
- Subscribe
- Mute
- Subscribe to RSS Feed
- Permalink
- Report Inappropriate Content
no one to answer me ?
Morgane