Unlock a world of possibilities! Login now and discover the exclusive benefits awaiting you.
- Qlik Community
- :
- All Forums
- :
- QlikView App Dev
- :
- How to Find gap between two different sales in bar...
- Subscribe to RSS Feed
- Mark Topic as New
- Mark Topic as Read
- Float this Topic for Current User
- Bookmark
- Subscribe
- Mute
- Printer Friendly Page
- Mark as New
- Bookmark
- Subscribe
- Mute
- Subscribe to RSS Feed
- Permalink
- Report Inappropriate Content
How to Find gap between two different sales in bar chart
Hi Qlikers,
@sunny_talwar can you look on to this
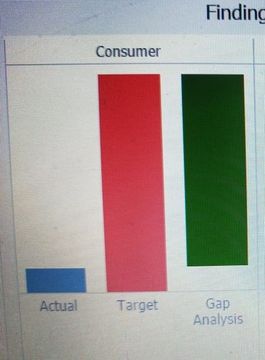
I want to show the gap between actual sales and target_sales in the form of bellow picture type
Data is like bellow
| Category | Sub Category | Year | Actual_Sales | Target_Sales |
| A | A1 | 2018 | 10 | 20 |
| A | A2 | 2018 | 2 | 5 |
| A | A3 | 2019 | 42 | 20 |
| A | A4 | 2019 | 11 | 10 |
| B | B1 | 2018 | 10 | 25 |
| B | B2 | 2018 | 2 | 10 |
| B | B3 | 2019 | 30 | 30 |
| C | C1 | 2018 | 11 | 22 |
| C | C2 | 2018 | 23 | 30 |
| C | C3 | 2018 | 40 | 50 |
| C | C4 | 2019 | 20 | 15 |
| C | C5 | 2019 | 11 | 20 |
please give any suggestions
thanks in advance
Accepted Solutions
- Mark as New
- Bookmark
- Subscribe
- Mute
- Subscribe to RSS Feed
- Permalink
- Report Inappropriate Content
The gap should be =sum(Actal_Sales)
The expression should be sum(Target_Sales)-sum(Actual_Sales)
Qlik Community MVP
- Mark as New
- Bookmark
- Subscribe
- Mute
- Subscribe to RSS Feed
- Permalink
- Report Inappropriate Content
Thanks for spending valuable time
I find out the solution
In Bar-Offset I set expression for giving starting position like sum(Actual_Sales) so it will give exactly what I am expecting
- Mark as New
- Bookmark
- Subscribe
- Mute
- Subscribe to RSS Feed
- Permalink
- Report Inappropriate Content
- Mark as New
- Bookmark
- Subscribe
- Mute
- Subscribe to RSS Feed
- Permalink
- Report Inappropriate Content
Hi Miskimez,
Thanks for the reply
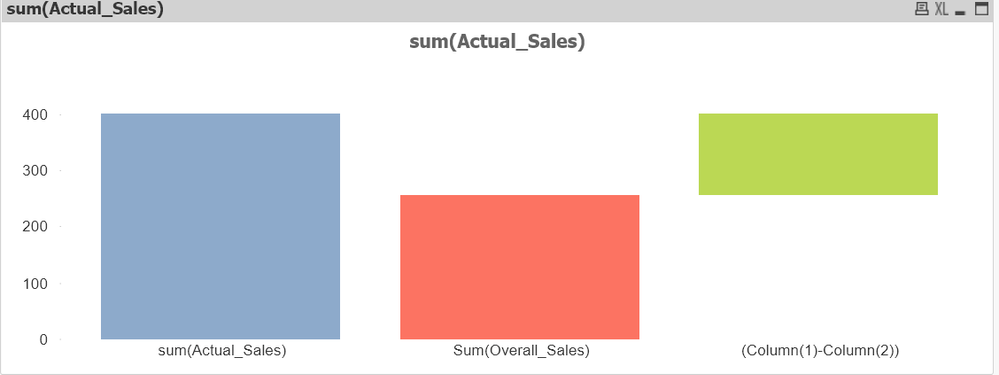
I set an expression Actal_Sales-Target_sales in bar offset but it will give bellow pic
please give any suggestions
- Mark as New
- Bookmark
- Subscribe
- Mute
- Subscribe to RSS Feed
- Permalink
- Report Inappropriate Content
The gap should be =sum(Actal_Sales)
The expression should be sum(Target_Sales)-sum(Actual_Sales)
Qlik Community MVP
- Mark as New
- Bookmark
- Subscribe
- Mute
- Subscribe to RSS Feed
- Permalink
- Report Inappropriate Content
Thanks for spending valuable time
I find out the solution
In Bar-Offset I set expression for giving starting position like sum(Actual_Sales) so it will give exactly what I am expecting


