Unlock a world of possibilities! Login now and discover the exclusive benefits awaiting you.
- Qlik Community
- :
- All Forums
- :
- QlikView App Dev
- :
- Line Chart Weekly Trend
- Subscribe to RSS Feed
- Mark Topic as New
- Mark Topic as Read
- Float this Topic for Current User
- Bookmark
- Subscribe
- Mute
- Printer Friendly Page
- Mark as New
- Bookmark
- Subscribe
- Mute
- Subscribe to RSS Feed
- Permalink
- Report Inappropriate Content
Line Chart Weekly Trend
Please help me in creating the line chart having weekly trend for while month as below excel screenshot.
Thanks in advance.
- Tags:
- new_to_qlikview
Accepted Solutions
- Mark as New
- Bookmark
- Subscribe
- Mute
- Subscribe to RSS Feed
- Permalink
- Report Inappropriate Content
Hi Pradeep,
Are you looking like the below screenshot, right?
As i mentioned, you can use =Date(DateField,'WWW') in calculated Dimension field
I think you are using field with Timp_stamp, then you can try like
=Date(floor(DateField),'WWW')
Sample attached.
- Mark as New
- Bookmark
- Subscribe
- Mute
- Subscribe to RSS Feed
- Permalink
- Report Inappropriate Content
Try in calculated dimension. . Like
=Date (YourDateField,'WWW')
- Mark as New
- Bookmark
- Subscribe
- Mute
- Subscribe to RSS Feed
- Permalink
- Report Inappropriate Content
hi,
thanks for your response.
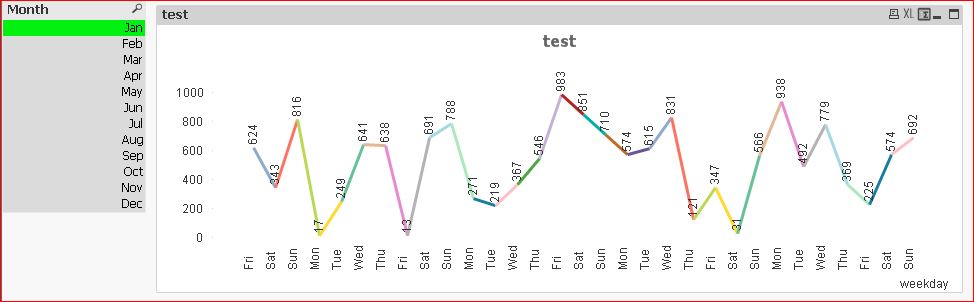
I want to segregate the data in weekly basis and I don't want it get grouped based on weekday, please help me.
for the above function below is the result.

- Mark as New
- Bookmark
- Subscribe
- Mute
- Subscribe to RSS Feed
- Permalink
- Report Inappropriate Content
May be use
=Week (Date field )
- Mark as New
- Bookmark
- Subscribe
- Mute
- Subscribe to RSS Feed
- Permalink
- Report Inappropriate Content
Hi,
Week function will give me week no but i want weekday..
- Mark as New
- Bookmark
- Subscribe
- Mute
- Subscribe to RSS Feed
- Permalink
- Report Inappropriate Content
Hi Pradeep,
Are you looking like the below screenshot, right?
As i mentioned, you can use =Date(DateField,'WWW') in calculated Dimension field
I think you are using field with Timp_stamp, then you can try like
=Date(floor(DateField),'WWW')
Sample attached.
- Mark as New
- Bookmark
- Subscribe
- Mute
- Subscribe to RSS Feed
- Permalink
- Report Inappropriate Content
hi Settu,
I got what I want, thanks man .. you are awesome...:-)
- Mark as New
- Bookmark
- Subscribe
- Mute
- Subscribe to RSS Feed
- Permalink
- Report Inappropriate Content
hi settu,
I am facing new challenge now, how to wrap the dimension fields to a month because my graph is growing more than 6 weeks in x_axis. please help me
- Mark as New
- Bookmark
- Subscribe
- Mute
- Subscribe to RSS Feed
- Permalink
- Report Inappropriate Content
Hi Pradeep,
i don't get you. Can you post the screen shot?
Do you mean, X-Axis value limit? is so, Enable the X-Axis Scrollbar in Presentation Tab.
- Mark as New
- Bookmark
- Subscribe
- Mute
- Subscribe to RSS Feed
- Permalink
- Report Inappropriate Content
Dear Sir/Madam,
I have the pleasure to brief you on our Data Visualization software
"Trend Compass".
TC is a new concept in viewing statistics & trends in an animated way
by displaying in one chart 5 axis (X, Y, Time, Bubble size & Bubble
color) instead of just the traditional X and Y axis. Discover trends
hidden in spreadsheets. It could be used in analysis, research,
presentation etc. In different business sectors, to name a few we
have Deutsche Bank, NBC Universal, RIM, Vanguard Institutional
Investor, Ipsos, Princeton University as our clients.
Link on Drilling feature (Parent/Child) - Just double-click on any bubble:
http://www.epicsyst.com/test/v2/drilling/
NBC presentation on TED using Trend Compass exported Videos on CNN
Money/Fortune:
Link on our new Geographical Trend Compass (Earthquake in Japan - Mag
vs Depth vs Time):
http://www.epicsyst.com/test/v2/japan-earthquake
Link on Ads Monitoring on TV Satellite Channels.
http://www.epicsyst.com/test/v2/tv-monitor/
Link on UK Master Card vs Visa performance :
http://www.epicsyst.com/test/v2/mastercard_vs_visa/
Links on Funds:
http://www.epicsyst.com/test/v2/best_exchange_traded_funds/
http://www.epicsyst.com/test/v2/us_insurance_funds/
http://www.epicsyst.com/test/v2/aaim_fund_performance/
Link on other KPIs :
http://www.epicsyst.com/test/v2/hospital_performance/
Link on Chile's Earthquake (Feb 27th 2010):
http://www.epicsyst.com/test/v2/EarthQuakeinChile/
Link on weather data :
http://www.epicsyst.com/test/v2/aims/
Bank link to compare Deposits, Withdrawals and numbers of Customers
for different branches over time:
http://www.epicsyst.com/test/v2/bank-trx/
Misc Examples :
http://www.epicsyst.com/test/v2/airline/
http://www.epicsyst.com/test/v2/stockmarket1/
http://www.epicsyst.com/test/v2/football/
http://www.epicsyst.com/test/v2/swinefludaily/
http://www.epicsyst.com/test/v2/babyboomers/
Princeton University project on US unemployment :
http://www.epicsyst.com/main3.swf
A video presentation by Professor Alan Krueger Bendheim Professor of
Economics and Public Affairs at Princeton University and currently
Chief Economist at the US Treasury:
http://epicsyst.com/trendcompass/princeton.aspx?home=1
You can download a trial version. It has a feature to export
EXE,PPS,HTML and AVI files. The most impressive is the AVI since you
can record Audio/Video for the charts you create.
http://www.epicsyst.com/TrendCompass/FreeVersion/TrendCompassv1.2.2.zip
Video on Trend Compass:
http://www.youtube.com/watch?v=gzDCGB8xBq4&feature=related
Since we already develop 3D Virtual Reality applications, please find
below a link on a prototype for a new 3D VR Trend Compass application:
http://www.youtube.com/watch?v=ueqULRUvikg&feature=related
Regards.
osama mohamed
Trend Compass Team
Epic Systems
www.epicsyst.com