Unlock a world of possibilities! Login now and discover the exclusive benefits awaiting you.
- Qlik Community
- :
- All Forums
- :
- QlikView App Dev
- :
- Making a bar chart red when above x money
- Subscribe to RSS Feed
- Mark Topic as New
- Mark Topic as Read
- Float this Topic for Current User
- Bookmark
- Subscribe
- Mute
- Printer Friendly Page
- Mark as New
- Bookmark
- Subscribe
- Mute
- Subscribe to RSS Feed
- Permalink
- Report Inappropriate Content
Making a bar chart red when above x money
Hii,
I have a bar chart with different projects. There are different costs in every project, the total of all those costs is shown in the chart per project.
Now I want a red line at the average + 25%. I didn't know how to do this, so I calculated it myself. So the red line is €45.574.
Now I want the green bar to become red when its over the €45.574 euro's. How do I do this? I try'd a lot of things but nothing works the right way.
Accepted Solutions
- Mark as New
- Bookmark
- Subscribe
- Mute
- Subscribe to RSS Feed
- Permalink
- Report Inappropriate Content
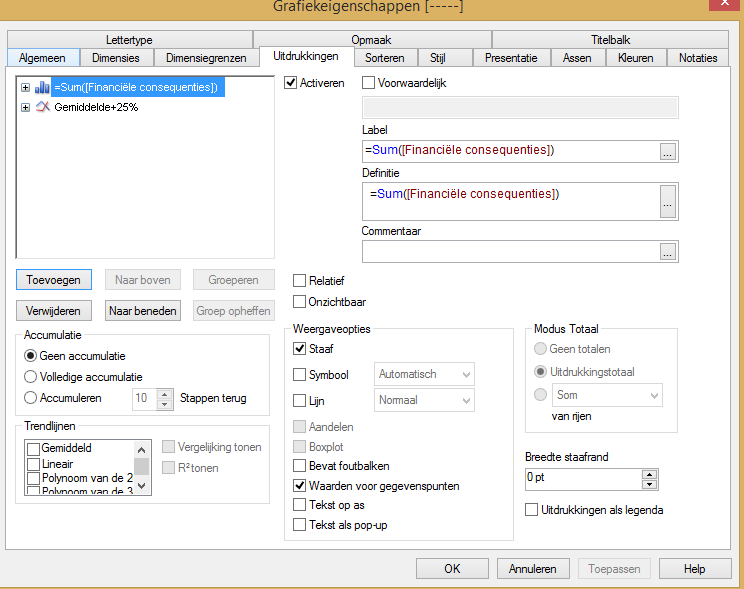
Expand the first expression and add a condition to the background colour option.
If(Sum(FieldName)>45.574,RGB(255,0,0),RGB(0,255,0))
- Mark as New
- Bookmark
- Subscribe
- Mute
- Subscribe to RSS Feed
- Permalink
- Report Inappropriate Content
Expand the first expression and add a condition to the background colour option.
If(Sum(FieldName)>45.574,RGB(255,0,0),RGB(0,255,0))