Unlock a world of possibilities! Login now and discover the exclusive benefits awaiting you.
- Qlik Community
- :
- All Forums
- :
- QlikView App Dev
- :
- Multiple fields in one bar chart
- Subscribe to RSS Feed
- Mark Topic as New
- Mark Topic as Read
- Float this Topic for Current User
- Bookmark
- Subscribe
- Mute
- Printer Friendly Page
- Mark as New
- Bookmark
- Subscribe
- Mute
- Subscribe to RSS Feed
- Permalink
- Report Inappropriate Content
Multiple fields in one bar chart
Hi guys, I'm new to qlikview, so I hope you can help me out.
Here is my objective. I got 4 fields with 200+ records in each fields, timing from 03:00 to 07:00hrs (Eg. PREPLAN_DT, DISPATCH_TIME)
I want to create a bucket of 10mins interval. Eg. 03:00, 03:10, 03:20 . . . 06:50, 07:00
So for each field, any records falls within the range will go to the bucket.
My y-axis will show the count of each field.
So 03:00 timing with have 4columns with different counts based on the fields and so on.
I did alot of research on the net and found that I can create the bucket in dimension with something like
=if([PREPLAN_DT] >= Timestamp#('03:00','hh:mm') and [PREPLAN_DT]<= Timestamp#('03:10','hh:mm'),'03:00',
if([PREPLAN_DT] >= Timestamp#('03:10','hh:mm') and [PREPLAN_DT]<= Timestamp#('03:20','hh:mm'),'03:10',
but when I put all 4 fields in 'expression' like Count(DISPATCH_TIME) and Count(PREPLAN_DT), all four columns display the same count.
Any help is appreciated. Thanks in advanced.
- Tags:
- new_to_qlikview
- « Previous Replies
-
- 1
- 2
- Next Replies »
Accepted Solutions
- Mark as New
- Bookmark
- Subscribe
- Mute
- Subscribe to RSS Feed
- Permalink
- Report Inappropriate Content
Hi, i tried to calculate it in the script.
edit your Load script;
LOAD TIME(FLOOR(DISPT_DT,0.006944444444),'hh:mm') AS Time,
.
.
.
in the graph you only need to COUNT(DisptTime).
I hope it might help you.
edit:
i changed it and used this script (details see attached File):
PT:
LOAD TIME(FLOOR(PreplanTime,0.006944444444),'hh:mm') AS Time,
PreplanTime AS PT
RESIDENT Table1;
DT:
LOAD TIME(FLOOR(DisptTime,0.006944444444),'hh:mm') AS Time,
DisptTime AS DT
RESIDENT Table1;
KS:
LOAD TIME(FLOOR(Key_Start,0.006944444444),'hh:mm') AS Time,
Key_Start AS KS
RESIDENT Table1;
KE:
LOAD TIME(FLOOR(Key_End,0.006944444444),'hh:mm') AS Time,
Key_End AS KE
RESIDENT Table1;
-------------------------------------------
- Mark as New
- Bookmark
- Subscribe
- Mute
- Subscribe to RSS Feed
- Permalink
- Report Inappropriate Content

This is my desired result.
- Mark as New
- Bookmark
- Subscribe
- Mute
- Subscribe to RSS Feed
- Permalink
- Report Inappropriate Content
Hi
This type of problem is best solved by using intervalmatch in your load script. Check the manual for intervalmatch and search here as there are many posts on this topic.
If you need more assistance, then I suggest that you upload your qvw file (and source files if possible) and someone will be able to provide more detailed help.
Regards
Jonathan
- Mark as New
- Bookmark
- Subscribe
- Mute
- Subscribe to RSS Feed
- Permalink
- Report Inappropriate Content
I do alot of trail and error but to no avail. Seriously require some help. 
Here is my qvw and source file
- Mark as New
- Bookmark
- Subscribe
- Mute
- Subscribe to RSS Feed
- Permalink
- Report Inappropriate Content
Any idea anyone? It's important to make this work.
- Mark as New
- Bookmark
- Subscribe
- Mute
- Subscribe to RSS Feed
- Permalink
- Report Inappropriate Content
The data file you uploaded does not match the load statement in the qvw file
- Mark as New
- Bookmark
- Subscribe
- Mute
- Subscribe to RSS Feed
- Permalink
- Report Inappropriate Content
Hi, Sorry about that. Now it should work. Place the excel in the same folder as the .qvw 
Use the one attached in this reply.
Thanks alot for your help
- Mark as New
- Bookmark
- Subscribe
- Mute
- Subscribe to RSS Feed
- Permalink
- Report Inappropriate Content
Hi, i tried to calculate it in the script.
edit your Load script;
LOAD TIME(FLOOR(DISPT_DT,0.006944444444),'hh:mm') AS Time,
.
.
.
in the graph you only need to COUNT(DisptTime).
I hope it might help you.
edit:
i changed it and used this script (details see attached File):
PT:
LOAD TIME(FLOOR(PreplanTime,0.006944444444),'hh:mm') AS Time,
PreplanTime AS PT
RESIDENT Table1;
DT:
LOAD TIME(FLOOR(DisptTime,0.006944444444),'hh:mm') AS Time,
DisptTime AS DT
RESIDENT Table1;
KS:
LOAD TIME(FLOOR(Key_Start,0.006944444444),'hh:mm') AS Time,
Key_Start AS KS
RESIDENT Table1;
KE:
LOAD TIME(FLOOR(Key_End,0.006944444444),'hh:mm') AS Time,
Key_End AS KE
RESIDENT Table1;
-------------------------------------------
- Mark as New
- Bookmark
- Subscribe
- Mute
- Subscribe to RSS Feed
- Permalink
- Report Inappropriate Content
Hi Stefan,
I followed your instruction and it does work but my ultimate objective is to include DISPT_DT, KEY_START_DT, KEY_END_DT, all three columns.
The desire result should be like this image 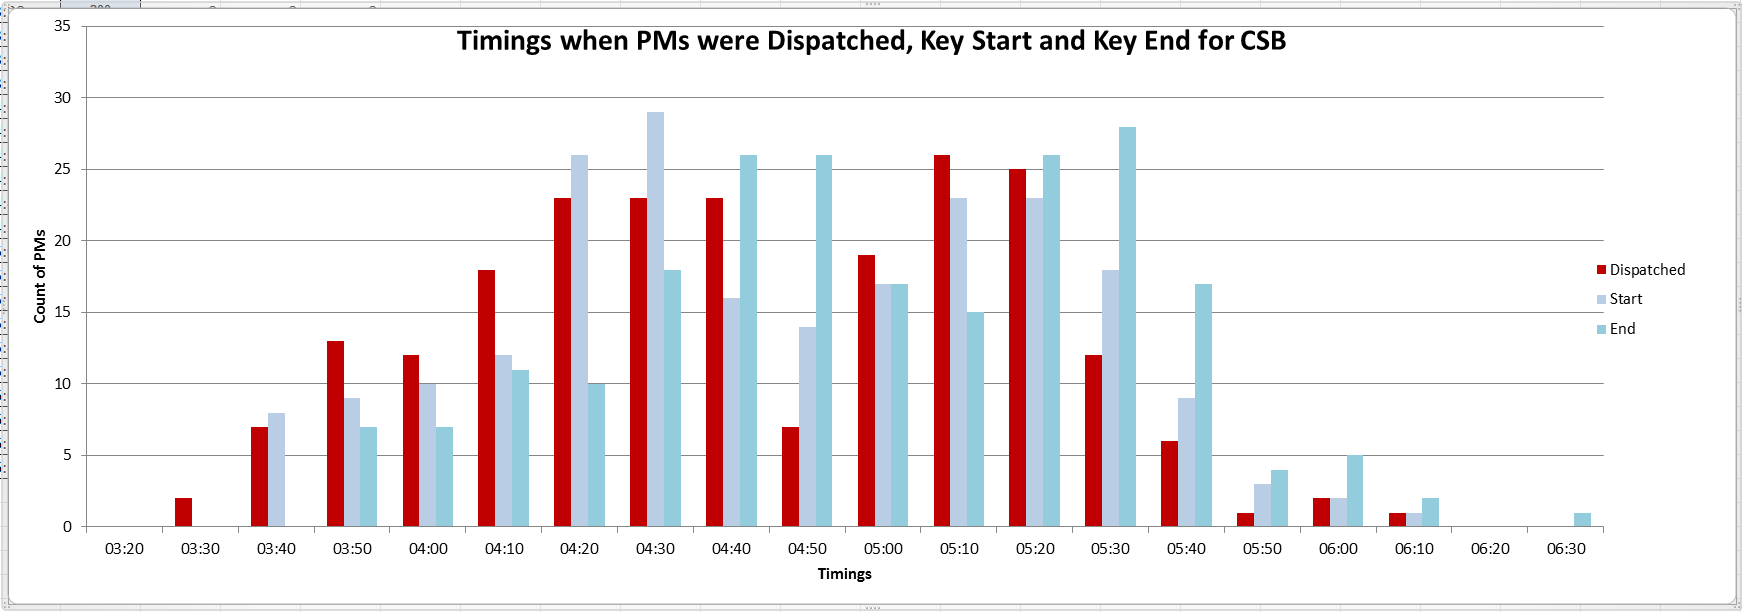
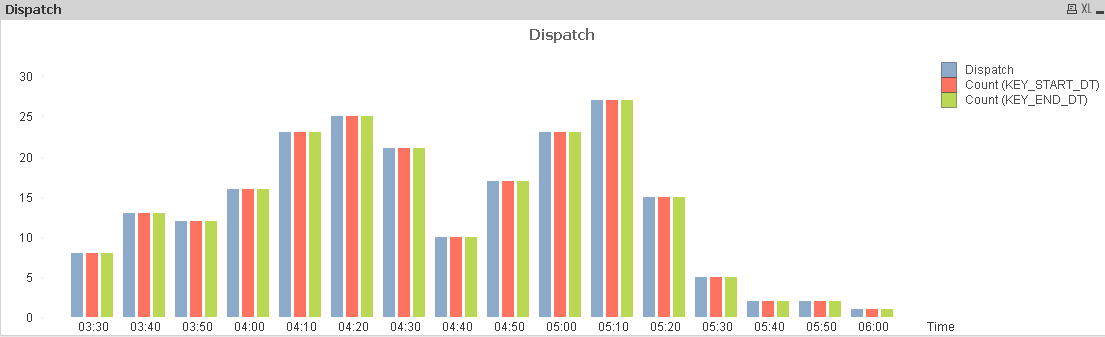
but I always got this kind of pattern
- Mark as New
- Bookmark
- Subscribe
- Mute
- Subscribe to RSS Feed
- Permalink
- Report Inappropriate Content
hi, i edit my post and attached a file with a better output.
- « Previous Replies
-
- 1
- 2
- Next Replies »