Unlock a world of possibilities! Login now and discover the exclusive benefits awaiting you.
- Qlik Community
- :
- All Forums
- :
- QlikView App Dev
- :
- Show unique values in pivot table
- Subscribe to RSS Feed
- Mark Topic as New
- Mark Topic as Read
- Float this Topic for Current User
- Bookmark
- Subscribe
- Mute
- Printer Friendly Page
- Mark as New
- Bookmark
- Subscribe
- Mute
- Subscribe to RSS Feed
- Permalink
- Report Inappropriate Content
Show unique values in pivot table
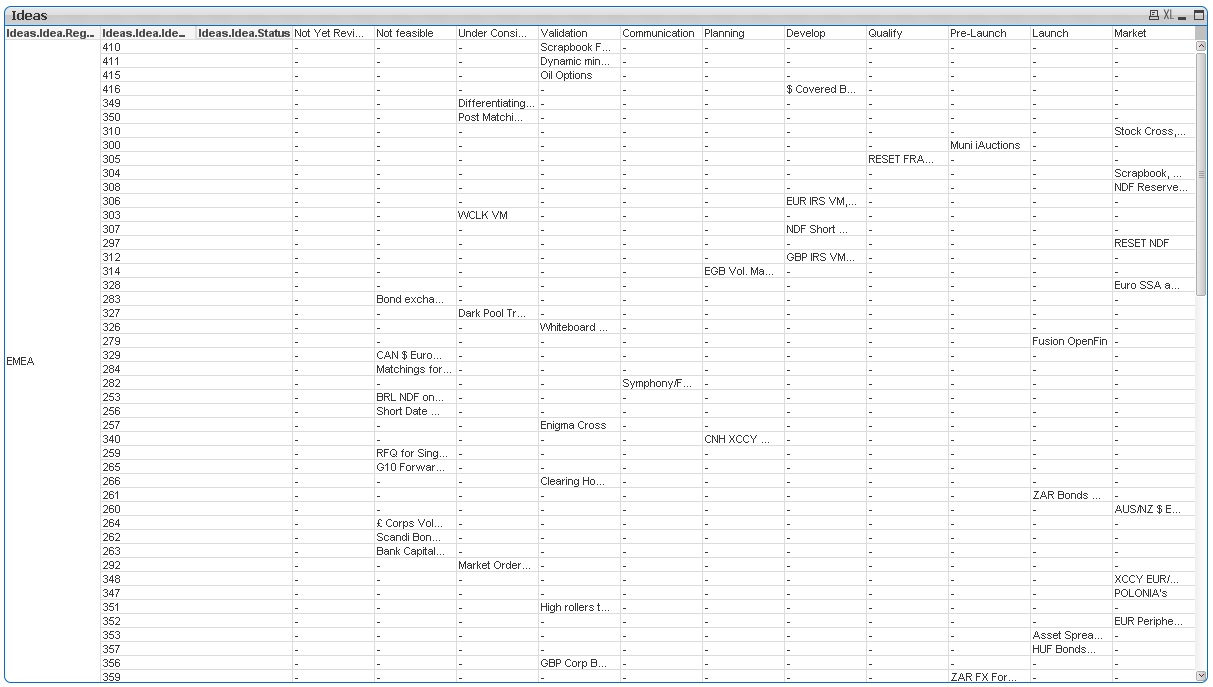
I have a pivot table showing 'Ideas' at various Statuses (x-axis dimension) by Region (y-axis dimension).

However it is only showing one Idea per region and stage, when I know for some there are multiple Ideas.
My expression is very simple:
=Ideas.Idea.Title
As are my dimensions, which simple list the field name. The are not calculated in any way.
How can i show ALL the ideas at each Status and Region?
- « Previous Replies
- Next Replies »
Accepted Solutions
- Mark as New
- Bookmark
- Subscribe
- Mute
- Subscribe to RSS Feed
- Permalink
- Report Inappropriate Content
That's the nature of showing dimensions in the way you are - unless there's a unique dimension value for each idea they'll be grouped and your expression will only show for region/stage combos that have only one potential value.
You could try use the concat() function which will give you all ideas for each combo, but this will format it inside of one cell, so if you have a lot of values it may not be a clear representation.
You'd need to add an ID dimension to return a unique value.
- Mark as New
- Bookmark
- Subscribe
- Mute
- Subscribe to RSS Feed
- Permalink
- Report Inappropriate Content
Tell me
"Ideas.Idea.Title" is your fieldname?
- Mark as New
- Bookmark
- Subscribe
- Mute
- Subscribe to RSS Feed
- Permalink
- Report Inappropriate Content
That's the nature of showing dimensions in the way you are - unless there's a unique dimension value for each idea they'll be grouped and your expression will only show for region/stage combos that have only one potential value.
You could try use the concat() function which will give you all ideas for each combo, but this will format it inside of one cell, so if you have a lot of values it may not be a clear representation.
You'd need to add an ID dimension to return a unique value.
- Mark as New
- Bookmark
- Subscribe
- Mute
- Subscribe to RSS Feed
- Permalink
- Report Inappropriate Content
Yes
- Mark as New
- Bookmark
- Subscribe
- Mute
- Subscribe to RSS Feed
- Permalink
- Report Inappropriate Content
You can try Concat(Idea field,',') as expression. If you have multiple values per region and status, it needs to be concatenated. Single field name in expression if results into multiple different values will show null in the output.
OR try Aggr(Concat(Idea filed,','),Region,status)
I think the first one should work if we have taken Region and status as dimensions in the chart.
Thanks,
- Mark as New
- Bookmark
- Subscribe
- Mute
- Subscribe to RSS Feed
- Permalink
- Report Inappropriate Content
OK, i have tried what you suggested and it works, but it's not ideal
I don't want the Idea Number dimension showing, nor do I want one row for each idea,as this make the table far too big
- Mark as New
- Bookmark
- Subscribe
- Mute
- Subscribe to RSS Feed
- Permalink
- Report Inappropriate Content
Can i insert a line break, rather than a comma?
- Mark as New
- Bookmark
- Subscribe
- Mute
- Subscribe to RSS Feed
- Permalink
- Report Inappropriate Content
try chr(10)
- Mark as New
- Bookmark
- Subscribe
- Mute
- Subscribe to RSS Feed
- Permalink
- Report Inappropriate Content
The other option as mentioned is using Concat. You could use Concat([Idea], chr(10)) and then wrap the cell height to the max number of ideas per combination to show this in a similar idea without needing the ID field.
- Mark as New
- Bookmark
- Subscribe
- Mute
- Subscribe to RSS Feed
- Permalink
- Report Inappropriate Content
That worked, but I now need to colour Ideas which have the Priority field set as 'High' red.
Is that possible within the same cell? If not, is there a different solution?
- « Previous Replies
- Next Replies »