Unlock a world of possibilities! Login now and discover the exclusive benefits awaiting you.
- Qlik Community
- :
- All Forums
- :
- QlikView App Dev
- :
- Sliding window over a period of 3 hours
- Subscribe to RSS Feed
- Mark Topic as New
- Mark Topic as Read
- Float this Topic for Current User
- Bookmark
- Subscribe
- Mute
- Printer Friendly Page
- Mark as New
- Bookmark
- Subscribe
- Mute
- Subscribe to RSS Feed
- Permalink
- Report Inappropriate Content
Sliding window over a period of 3 hours
Hello Everyone,
In attached qvw I would like to create a sliding window containing sum of pallets over 3 hours like the example in Excel.
I've been reading a lot about this but it's to complicated and technical to do it myself.
The QVW file contains the data needed to achieve this.
Can anybody please help me with this?
Kind regards,
Ambertje
- Tags:
- new_to_qlikview
Accepted Solutions
- Mark as New
- Bookmark
- Subscribe
- Mute
- Subscribe to RSS Feed
- Permalink
- Report Inappropriate Content
Hi,
one solution could be:
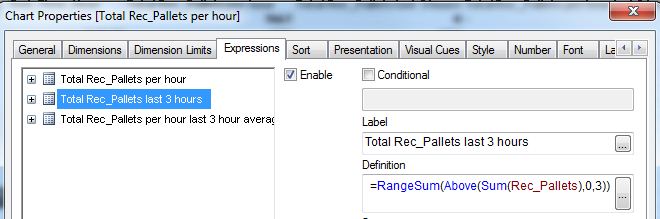
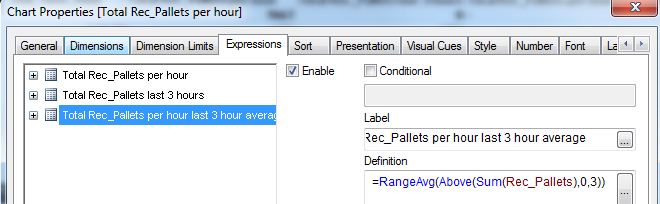
I changed your script to generate a seperate calendar table and an End_Time_Hour field containing all necessary full hours, even if there are no values for this hour, i.e. the rangesum(above(...)) will always find 3 consecutive hours:
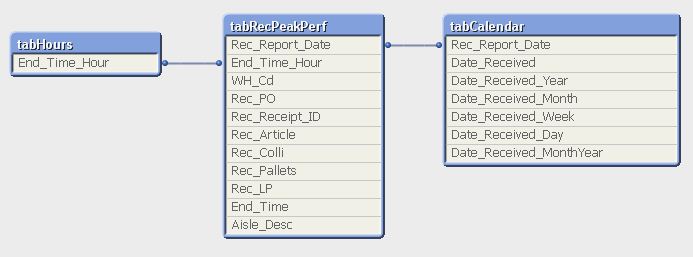
tabRecPeakPerf:
LOAD *,
    Interval(Floor(End_Time,1/24)) as End_Time_Hour;
LOAD Date#(Rec_Report_Date,'YYYYMMDD') as Rec_Report_Date,
    WH_Cd,
    Rec_PO,
    Rec_Receipt_ID,
    Rec_Article,
    Rec_Colli,
    Rec_Pallets,
    Rec_LP,
    Interval([Rec_End_Time] / 86400) as [End_Time],
    Aisle_Desc
FROM  (qvd);
//Q:\StockManagement\Monique\PROJECTEN\B.I\RECEPTIE\Reception_Peak_Performance.xls
//(biff, embedded labels);

tabCalendar:
LOAD *,
    Date(DayStart([Rec_Report_Date])) As [Date_Received],//wordt gevoed door het veld DT_Report_Dates as [PC_Report_Date] en dient voor de current selection etc.in te vullen
  Year([Rec_Report_Date]) As [Date_Received_Year],
  Month([Rec_Report_Date]) As [Date_Received_Month],
  Week([Rec_Report_Date]) As [Date_Received_Week],
  WeekDay([Rec_Report_Date]) As [Date_Received_Day],
  Date(Monthstart([Rec_Report_Date]),'MM-YYYY') As [Date_Received_MonthYear];
LOAD Date(MinDate+IterNo()-1) as Rec_Report_Date
While MinDate+IterNo()-1<=MaxDate;
LOAD Min(Rec_Report_Date) as MinDate,
    Max(Rec_Report_Date) as MaxDate
Resident tabRecPeakPerf;

tabHours:
LOAD Interval((IterNo()-1)/24) as End_Time_Hour
While (IterNo()-1)/24 <= MaxEndTime;
LOAD Max(End_Time) as MaxEndTime
Resident tabRecPeakPerf;
hope this helps
regards
Marco
- Mark as New
- Bookmark
- Subscribe
- Mute
- Subscribe to RSS Feed
- Permalink
- Report Inappropriate Content
Hi,
one solution could be:
I changed your script to generate a seperate calendar table and an End_Time_Hour field containing all necessary full hours, even if there are no values for this hour, i.e. the rangesum(above(...)) will always find 3 consecutive hours:
tabRecPeakPerf:
LOAD *,
    Interval(Floor(End_Time,1/24)) as End_Time_Hour;
LOAD Date#(Rec_Report_Date,'YYYYMMDD') as Rec_Report_Date,
    WH_Cd,
    Rec_PO,
    Rec_Receipt_ID,
    Rec_Article,
    Rec_Colli,
    Rec_Pallets,
    Rec_LP,
    Interval([Rec_End_Time] / 86400) as [End_Time],
    Aisle_Desc
FROM  (qvd);
//Q:\StockManagement\Monique\PROJECTEN\B.I\RECEPTIE\Reception_Peak_Performance.xls
//(biff, embedded labels);

tabCalendar:
LOAD *,
    Date(DayStart([Rec_Report_Date])) As [Date_Received],//wordt gevoed door het veld DT_Report_Dates as [PC_Report_Date] en dient voor de current selection etc.in te vullen
  Year([Rec_Report_Date]) As [Date_Received_Year],
  Month([Rec_Report_Date]) As [Date_Received_Month],
  Week([Rec_Report_Date]) As [Date_Received_Week],
  WeekDay([Rec_Report_Date]) As [Date_Received_Day],
  Date(Monthstart([Rec_Report_Date]),'MM-YYYY') As [Date_Received_MonthYear];
LOAD Date(MinDate+IterNo()-1) as Rec_Report_Date
While MinDate+IterNo()-1<=MaxDate;
LOAD Min(Rec_Report_Date) as MinDate,
    Max(Rec_Report_Date) as MaxDate
Resident tabRecPeakPerf;

tabHours:
LOAD Interval((IterNo()-1)/24) as End_Time_Hour
While (IterNo()-1)/24 <= MaxEndTime;
LOAD Max(End_Time) as MaxEndTime
Resident tabRecPeakPerf;
hope this helps
regards
Marco
- Mark as New
- Bookmark
- Subscribe
- Mute
- Subscribe to RSS Feed
- Permalink
- Report Inappropriate Content
Hi Marco,
Sorry for my late response but I've been very busy but now I can focus my attention on your solution.
Thank's a million for answering my question I really appreciate it.
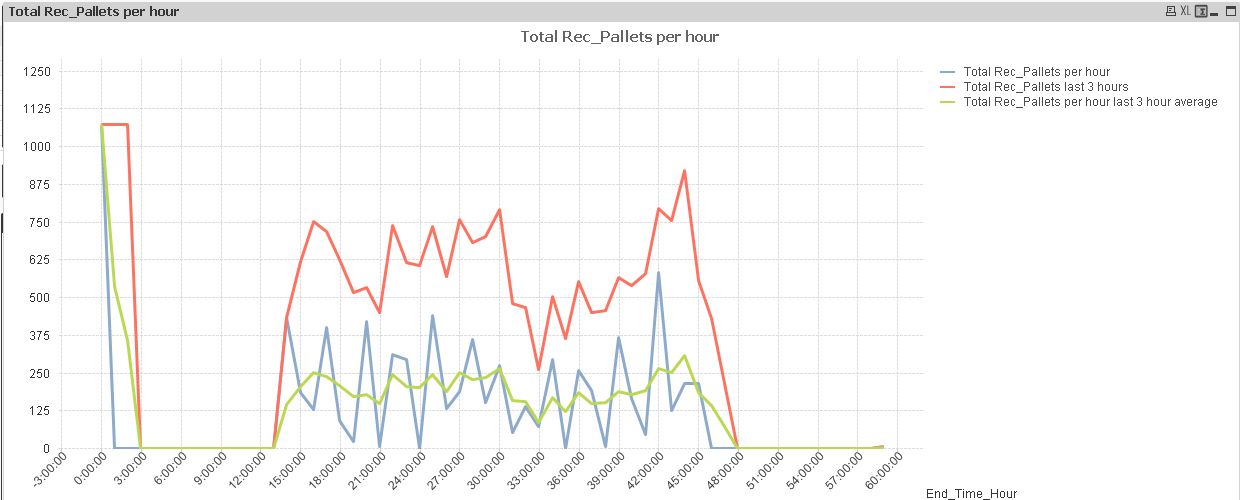
It looks great and the period over 3 hours works very good (it add's up perfectly).
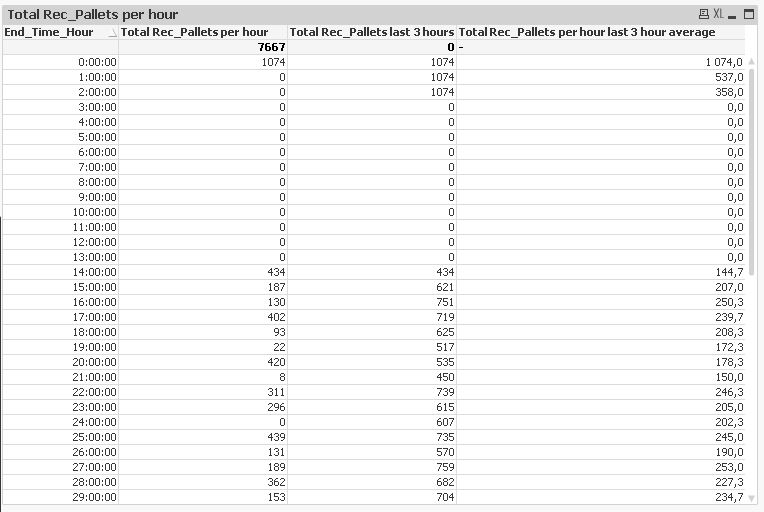
There's only one major issue: The expression Sum(Rec_Pallets) for Total Rec_Pallets per hour produces a wrong start value.
For example: if I select the 00:00:00 hour I see a total value of 429 pallets in the table with all the dimensions.
When I look to the table where all the calculations are done I see a total value of 1074 pallets.
This is the case for every hour I select.
Do you have any idea how this is possible please?
Kind regards,
Ambertje
- Mark as New
- Bookmark
- Subscribe
- Mute
- Subscribe to RSS Feed
- Permalink
- Report Inappropriate Content
Marco,
Found the cause of the difference, I've used an expression where I exclude some values and in the new sliding window table this was'nt the case.
I corrected this and now it looks and works super fantastic.
Thanks a million Marco, I'm so glad this forum exists and you guys (and girls) are willing to help the desperate.
Kind regards,
Ambertje
- Mark as New
- Bookmark
- Subscribe
- Mute
- Subscribe to RSS Feed
- Permalink
- Report Inappropriate Content
glad I could help.
Please close this thread if your question is answered.
thanks
regards
Marco
- Mark as New
- Bookmark
- Subscribe
- Mute
- Subscribe to RSS Feed
- Permalink
- Report Inappropriate Content
Marco,
Sorry to bother you again but can you explain to me what the function IterNo() is doing in the tabHours and tabCalendar please?
My knowledge of writing loops is as good as non existing.
I discovered that it is a while loop but I don't see what it is doing exatly (I can see that it's looping while the record isn't the Maximum endtime), why IterNo() -1) /24 ?
If possible can you explain with simple example please?
kind regards,
Ambertje