Unlock a world of possibilities! Login now and discover the exclusive benefits awaiting you.
- Qlik Community
- :
- All Forums
- :
- QlikView App Dev
- :
- Re: Split Subtotals in pivot table
- Subscribe to RSS Feed
- Mark Topic as New
- Mark Topic as Read
- Float this Topic for Current User
- Bookmark
- Subscribe
- Mute
- Printer Friendly Page
- Mark as New
- Bookmark
- Subscribe
- Mute
- Subscribe to RSS Feed
- Permalink
- Report Inappropriate Content
Split Subtotals in pivot table
Hello,
is there any way to split the subtotals by a sub-dimension in a pivot table?
For example:
| Header 1 | Header 2 | Header 3 | Header 4 | Header 5 | Header 6 | Header 7 | Header 8 |
|---|---|---|---|---|---|---|---|
| MONTH | JAN | JAN | FEB | FEB | TOTAL | TOTAL | |
| TYPE | YEAR | 2016 | 2017 | 2016 | 2017 | 2016 | 2017 |
| CAR | 10 | 20 | 15 | 25 | 25 | 45 | |
| BIKE | 1 | 4 | 10 | 0 | 11 | 4 | |
| HOUSE | 2 | 5 | 8 | 15 | 10 | 20 |
If I select to compute subtotals for the dimension "MONTH", I can only get the total sum of the row (2016+2017), which is meaningless to me. Also, I don't want to switch YEAR and MONTH dimension, because I'd like to do a comparison by months.
I've also attached a .qvw as an example of what I'm trying to achieve.
Any help will be really appreciated.
- « Previous Replies
-
- 1
- 2
- Next Replies »
- Mark as New
- Bookmark
- Subscribe
- Mute
- Subscribe to RSS Feed
- Permalink
- Report Inappropriate Content
Still don't know if I've understood the matter properly, just for the benefit of the topic I will try to sum it up:
- create a new dimension as a linear table within the load script. Values of the table will be just 1 and 2;
- create a new calculated dimension as "=Pick(Dim, DIMENSION, 'Total')" where:
- Dim is the linear dimension
- DIMENSIONis the 'parent' dimension - the one we want to be split
- 'Total' is the label you wnat to give to the "total" at the bottom/start of the table - hadn't tried myself, but I think you can put the total at the begin of the table by just switching the order between COLUMN and 'Total' within the Pick function
- create a new expression in the expression tab (subtotals should not be selected)
Alla other options in the .qvw file are just for formatting reasons.
The trick mechanic is (or at least I think it works because):
- loading a new linear dimension forces QlikView to doble the rows in the loaded data;
- DIMENSION is now computed and QlikView forces it to be:
- DIMENSION, when label is 1
- A simple label when label is 2: due to the fact that data is doubled, the returned value is 'Total' and the data is equal to all the choosen repository. Data can also be divided in all the desired sub-dimension.
My question is: in terms of performance does this affect badly my QlikView application? Are there any disvantages due to the fact that data are doubled? Maybe in a big application you need some precautions when using this tecnique?
- Mark as New
- Bookmark
- Subscribe
- Mute
- Subscribe to RSS Feed
- Permalink
- Report Inappropriate Content
Look at my responses in red below
Giacomo Berdondini wrote:
Still don't know if I've understood the matter properly, just for the benefit of the topic I will try to sum it up:
- create a new dimension as a linear table within the load script. Values of the table will be just 1 and 2;
- create a new calculated dimension as "=Pick(Dim, DIMENSION, 'Total')" where:
- Dim is the linear dimension
- DIMENSIONis the 'parent' dimension - the one we want to be split
- 'Total' is the label you wnat to give to the "total" at the bottom/start of the table - hadn't tried myself, but I think you can put the total at the begin of the table by just switching the order between COLUMN and 'Total' within the Pick function
- To change the location of Total, I suggest using the sort tab. You can also bring it in the middle or wherever it would make sense for you to see it.
- create a new expression in the expression tab (subtotals should not be selected)
- That is correct
Alla other options in the .qvw file are just for formatting reasons.
The trick mechanic is (or at least I think it works because):
- loading a new linear dimension forces QlikView to doble the rows in the loaded data;
- This is not true... we are not doubling the data here. Dim is just a island table which won't impact your other tables.
- DIMENSION is now computed and QlikView forces it to be:
- DIMENSION, when label is 1
- That is right
- A simple label when label is 2: due to the fact that data is doubled, the returned value is 'Total' and the data is equal to all the choosen repository. Data can also be divided in all the desired sub-dimension.
- Not sure I understand this
My question is: in terms of performance does this affect badly my QlikView application? Are there any disvantages due to the fact that data are doubled? Maybe in a big application you need some precautions when using this tecnique?
There will definitely some impact to performance, but it is going to be negligible to little based on the size of the application. Also, like I mentioned that you are not doubling the data, so there are no disadvantages there. I can't think of any precautions, but you might need to modify it if you need to make changes. For instance if you need DIMENSION, Total and Avg, then you will need to increase the value of Dim from 1 and 2 to 1, 2, and 3. and there can be other changes that you might need.
- Mark as New
- Bookmark
- Subscribe
- Mute
- Subscribe to RSS Feed
- Permalink
- Report Inappropriate Content
Ok, thank you Sunny, it really helped me understanding some of the QlikView mechanics.
Thank you for your time.
Giacomo
- Mark as New
- Bookmark
- Subscribe
- Mute
- Subscribe to RSS Feed
- Permalink
- Report Inappropriate Content
No problem at all 
I am glad I was able to offer some help here
- Mark as New
- Bookmark
- Subscribe
- Mute
- Subscribe to RSS Feed
- Permalink
- Report Inappropriate Content
Another problem...
If I'm using a set expression to limit result in the "Total" expression, and thank if I want to use an additional calculated espression (for example to compute the percentage growth from one year to the next one), all rows are shown with 0 value (even the ones outside the selection of my set expression).
I've attached a file to make more clear what I'm trying to achieve
- Mark as New
- Bookmark
- Subscribe
- Mute
- Subscribe to RSS Feed
- Permalink
- Report Inappropriate Content
Like I mentioned above, you can further use the Pick match technique to work on this... Just so I understand, you are looking to only show diff where there is a value? remove where it is null?
- Mark as New
- Bookmark
- Subscribe
- Mute
- Subscribe to RSS Feed
- Permalink
- Report Inappropriate Content
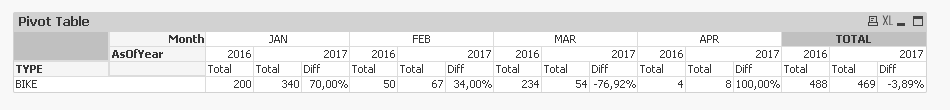
Yes, following the example above I would like to have the % difference, for each month, between the 2016 and the 2017 value. I tried to play around Pick and Match but couldn't get any result as of now.
- Mark as New
- Bookmark
- Subscribe
- Mute
- Subscribe to RSS Feed
- Permalink
- Report Inappropriate Content
This?
- Mark as New
- Bookmark
- Subscribe
- Mute
- Subscribe to RSS Feed
- Permalink
- Report Inappropriate Content
That is definetly what I was trying to achive, I'm going to play around it a little to make it work properly for my application.
Thank you again.
- Mark as New
- Bookmark
- Subscribe
- Mute
- Subscribe to RSS Feed
- Permalink
- Report Inappropriate Content
I am glad it worked
- « Previous Replies
-
- 1
- 2
- Next Replies »