Unlock a world of possibilities! Login now and discover the exclusive benefits awaiting you.
- Qlik Community
- :
- All Forums
- :
- QlikView App Dev
- :
- Re: Variables behind a button
- Subscribe to RSS Feed
- Mark Topic as New
- Mark Topic as Read
- Float this Topic for Current User
- Bookmark
- Subscribe
- Mute
- Printer Friendly Page
- Mark as New
- Bookmark
- Subscribe
- Mute
- Subscribe to RSS Feed
- Permalink
- Report Inappropriate Content
Variables behind a button
Hoping someone can help.
In the attached example, how do i get it that when the past date button is selected that the table on the right reflects to just show those that fall within the criteria of the variables behind the text boxes.
Thanks.
- « Previous Replies
-
- 1
- 2
- Next Replies »
- Mark as New
- Bookmark
- Subscribe
- Mute
- Subscribe to RSS Feed
- Permalink
- Report Inappropriate Content
I don't think I follow you completely here... Let's take your example and look at the image below
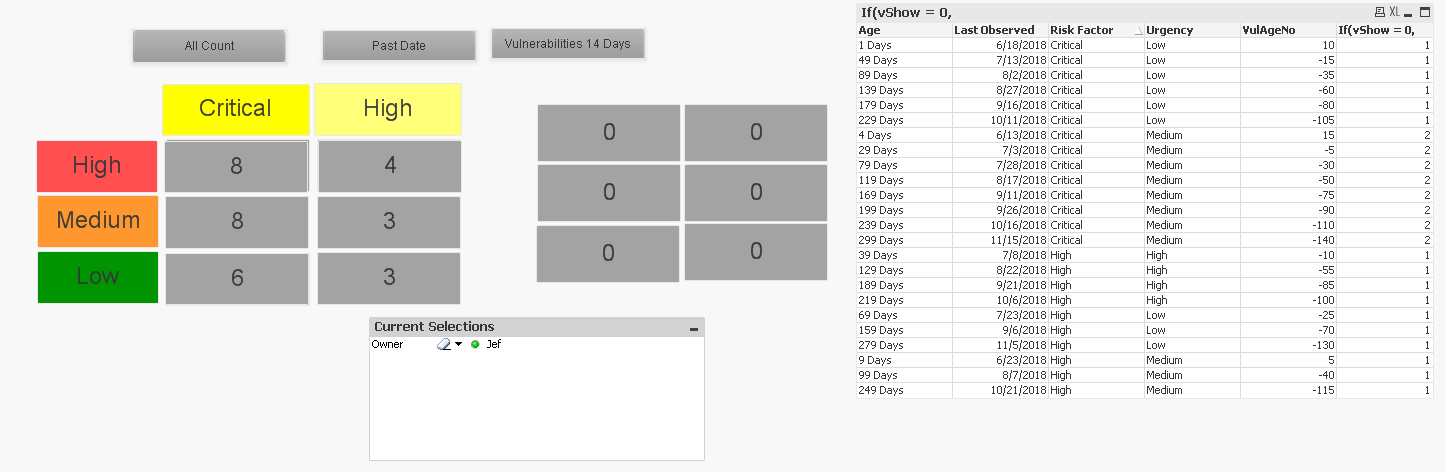
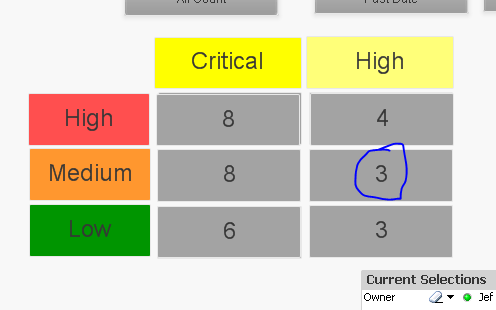
I selected Jeff... and for Medium Urgency and High Risk Factor... I see 3, how are you getting 8?
Also, if you see in the table... I see 3 rows... where do you see 22 rows?
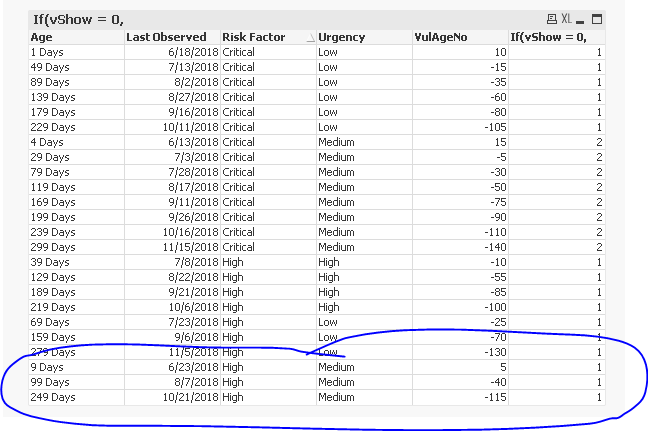
What am I missing?
- Mark as New
- Bookmark
- Subscribe
- Mute
- Subscribe to RSS Feed
- Permalink
- Report Inappropriate Content
if you select through the drill down chart that was also attached the numbers are incorrect.
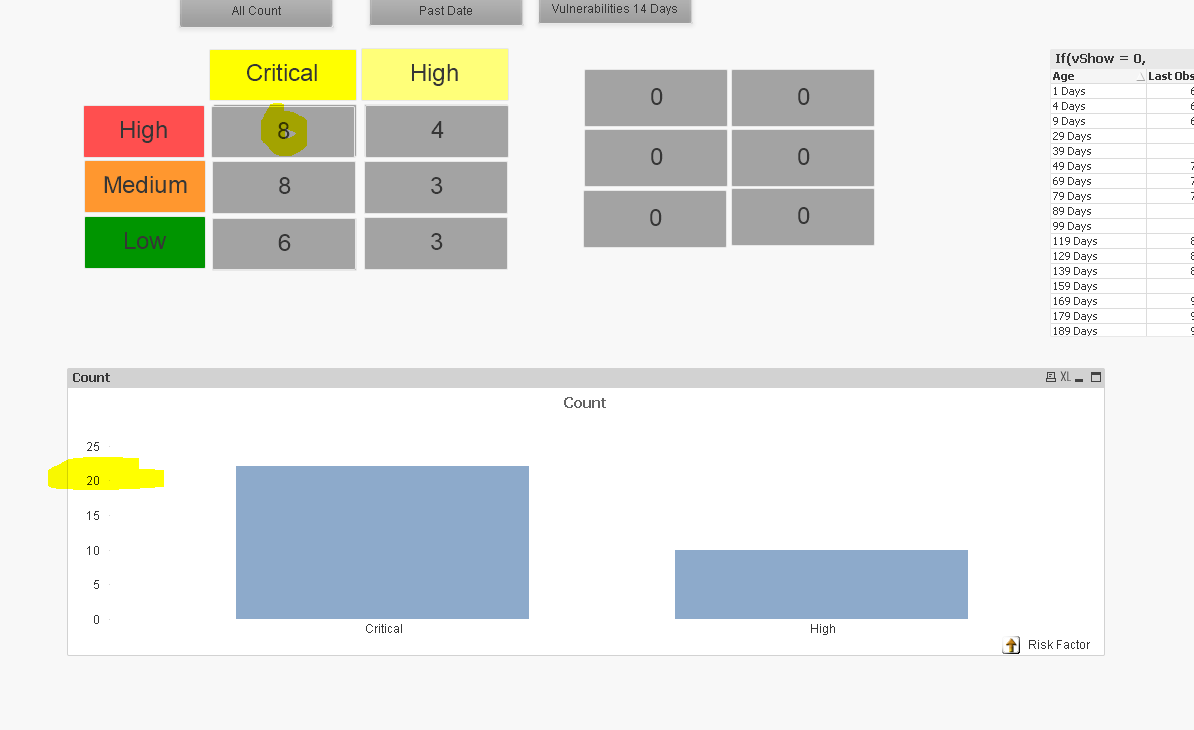
*Apologies, I mean't Medium and Critical
- Mark as New
- Bookmark
- Subscribe
- Mute
- Subscribe to RSS Feed
- Permalink
- Report Inappropriate Content
There are multiple issues
1) You are using set analysis in your variable to show specific value regardless of selection in Urgency and Risk Factor... to fix this... you can try this
Sum(Aggr(If(vShow = 0,
RangeSum($(vCriticalHighPD), $(vHighHighPD), $(vCriticalMediumPD), $(vHighMediumPD), $(vCriticalLowPD), $(vHighLowPD)),
If(vShow = 1,
RangeSum($(vCriticalHigh), $(vHighHigh), $(vCriticalMedium), $(vHighMedium), $(vCriticalLow), $(vHighLow)),
RangeSum($(vHighHighN14), $(vCriticalMediumN14), $(vHighMediumN14), $(vCriticalLowN14), $(vHighLowN14)))), Age, [Last Observed], [Risk Factor], Urgency))
2) One of your variable vCriticalHigh was incorrectly specified
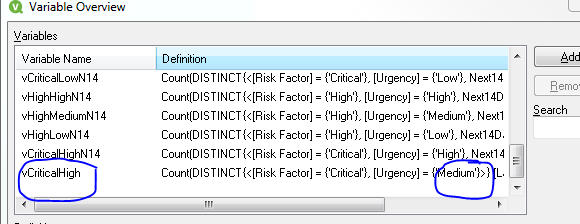
So, basically Urgency Medium was getting double counted....
- Mark as New
- Bookmark
- Subscribe
- Mute
- Subscribe to RSS Feed
- Permalink
- Report Inappropriate Content
Fixed the wrongly specified variable (thank you!)
However, the if statement now does not show half of my owners in the chart....?
- Mark as New
- Bookmark
- Subscribe
- Mute
- Subscribe to RSS Feed
- Permalink
- Report Inappropriate Content
See if this helps
Sum(Aggr(If(vShow = 0,
RangeSum($(vCriticalHighPD), $(vHighHighPD), $(vCriticalMediumPD), $(vHighMediumPD), $(vCriticalLowPD), $(vHighLowPD)),
If(vShow = 1,
RangeSum($(vCriticalHigh), $(vHighHigh), $(vCriticalMedium), $(vHighMedium), $(vCriticalLow), $(vHighLow)),
RangeSum($(vHighHighN14), $(vCriticalMediumN14), $(vHighMediumN14), $(vCriticalLowN14), $(vHighLowN14)))), Owner, Age, [Last Observed], [Risk Factor], Urgency))
- Mark as New
- Bookmark
- Subscribe
- Mute
- Subscribe to RSS Feed
- Permalink
- Report Inappropriate Content
I have discovered that using the sum(agrr(
it is not showing any Low or medium results in my chart, only critical and high?
they have data in the load but just aren't showing through that expression.
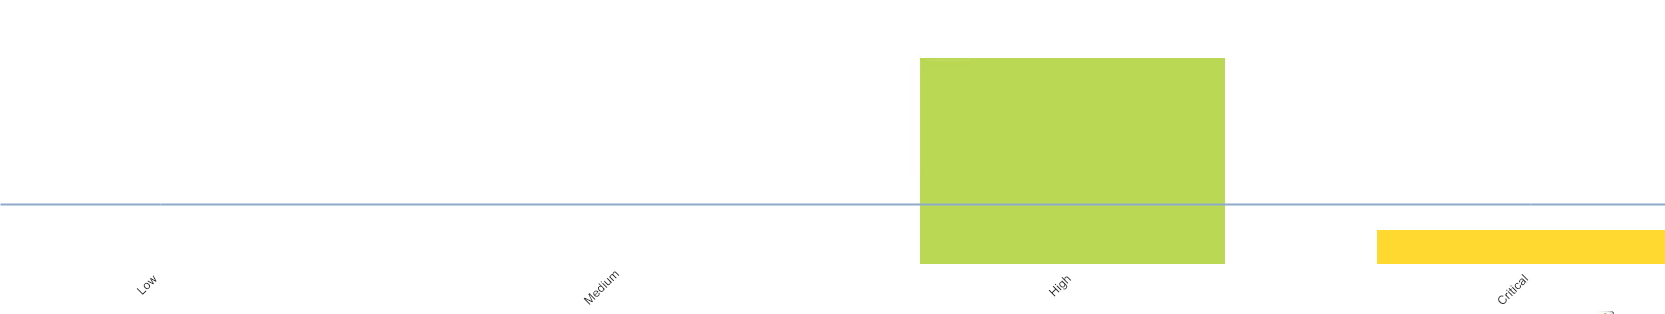
Any advice?
- Mark as New
- Bookmark
- Subscribe
- Mute
- Subscribe to RSS Feed
- Permalink
- Report Inappropriate Content
Without seeing, nope... sorry 
- « Previous Replies
-
- 1
- 2
- Next Replies »