Unlock a world of possibilities! Login now and discover the exclusive benefits awaiting you.
- Qlik Community
- :
- Blogs
- :
- Technical
- :
- Design
- :
- Counter Aggregation Functions
- Subscribe to RSS Feed
- Mark as New
- Mark as Read
- Bookmark
- Subscribe
- Printer Friendly Page
- Report Inappropriate Content
Today I am going to blog about five Counter Aggregation Functions that can be used in Qlik Sense and QlikView in both charts expressions and the script.
- Count()
- MissingCount()
- NullCount()
- NumericCount()
- TextCount()
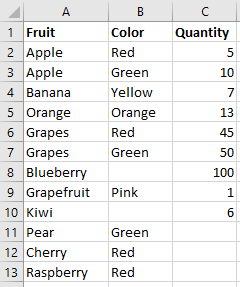
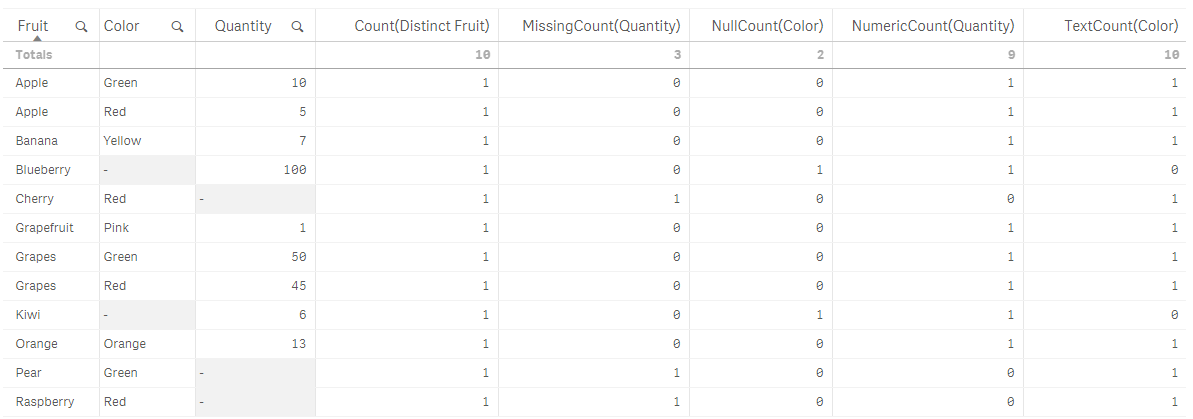
Before taking a closer look at how we can use each of these functions, let’s first look at the data set I will use for the examples. Below is the Excel data I will load. It is a simple list of fruits, their color and quantity.
1. Count()
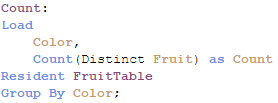
The Count function is probably one of the most common functions that can be used. In a chart, Count() aggregates the number of values in each chart dimension. In the script, Count() returns the number of values aggregated in the expression as defined by a group by clause.
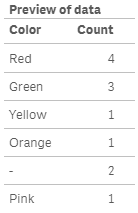
Expression for a chart: Count(Distinct Fruit)
In the script below, Count() will return color and the number of fruits that have that color.
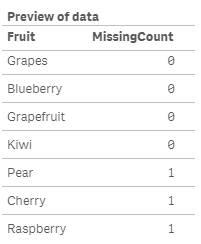
2. MissingCount()
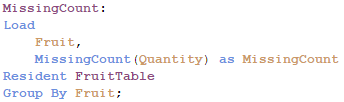
In a chart, the MissingCount() function will aggregate the number of missing values in each chart dimension. In the script, it will return the number of missing values aggregated in the expression, as defined by the group by clause.
Expression for a chart: MissingCount(Quantity)
In the script below, MissingCount() will return 1 if the Quantity field is missing a value.
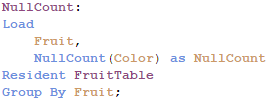
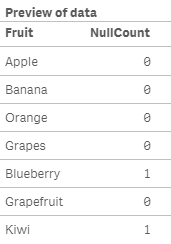
3. NullCount()
NullCount() will return the number of null values in each chart dimension in a chart. In the script, NullCount() returns the number of null values aggregated in the expression, as defined by a group by clause.
Expression for a chart: NullCount(Color)
In the script below, NullCount() returns 1 if the Color field is null.
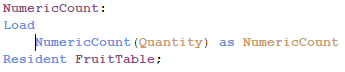
4. NumericCount()
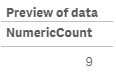
In a chart, NumericCount() aggregates the number of numeric values by each chart dimension and in the script, NumericCount() returns the number of numeric values found in the expression, as defined by a group by clause.
Expression for a chart: NumericCount(Quantity)
In the script below, the total Quantity fields that have numeric data is returned.
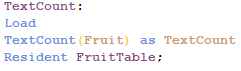
5. TextCount()
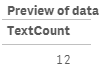
In a chart, TextCount() aggregates the number of non-numeric values by each chart dimension and in the script, TexCount() returns the number of non-numeric values found in the expression, as defined by a group by clause.
Expression for a chart: TextCount(Color)
In the script below, TextCount() will return the total number of text values in the Fruit field.
Here is a table with all these functions used in a chart:
While I have not used all of the counter aggregation functions in my work with QlikView and Qlik Sense, I think they can be valuable when auditing and checking the health of your data. They can highlight gaps in the data that should not be there and point out data type issues in the data. I would be interested in hearing how you use these functions in your apps.
Thanks,
Jennell
You must be a registered user to add a comment. If you've already registered, sign in. Otherwise, register and sign in.