Unlock a world of possibilities! Login now and discover the exclusive benefits awaiting you.
- Qlik Community
- :
- All Forums
- :
- Qlik NPrinting
- :
- How to apply the if condition on Nprinting tags in...
- Subscribe to RSS Feed
- Mark Topic as New
- Mark Topic as Read
- Float this Topic for Current User
- Bookmark
- Subscribe
- Mute
- Printer Friendly Page
- Mark as New
- Bookmark
- Subscribe
- Mute
- Subscribe to RSS Feed
- Permalink
- Report Inappropriate Content
How to apply the if condition on Nprinting tags in Excel template
Hi Team,
I am working in Nprinting November 2017 Excel template.
Requirement: I want to create Bar chart in Excel by pulling the image into Table node
I have tried the below way
Created the Bar chart in Qliksense. Pulled this Bar chart from qliksense to Nprinting excel template --> table node
I got the Dimension as Line , Measure as vOTP (this is a variable).
Now I fetched both these columns into Excel and removed the headers.
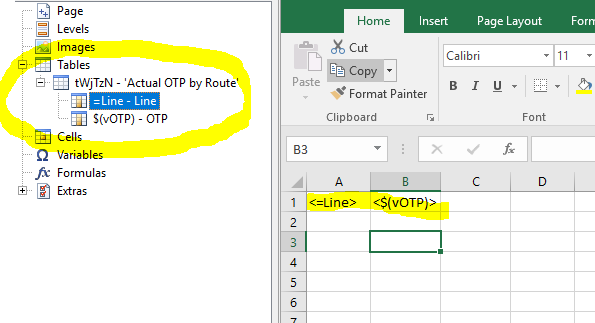
Now, I want to apply the if condition on Column B. after applying the if condition, it is returning only One value , that is available in C1.
But i want to see the same condition needs apply for the subsequent rows.
Note: If i just use the =B1 in C1 cell, it should return the same content like B1 but is returning only one value.
Please let me know if there is any possibility on this.
If condition i apllied: if(B1>90%, B1, "")
simple operation--> when i use =B1 in the cell C1
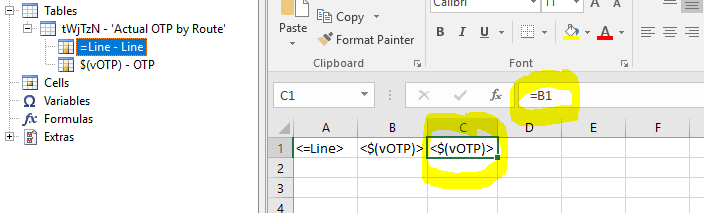
Reslut:

Regards
Srinivas
- Mark as New
- Bookmark
- Subscribe
- Mute
- Subscribe to RSS Feed
- Permalink
- Report Inappropriate Content
you can achieve this by either:
using level instead of table: details in official help https://help.qlik.com/en-US/nprinting/April2019/Content/NPrinting/ExcelReports/Make-Calculated-Colum...
or
inserting a XLS Table and placing your Nprinting tags in it samle here (marked as Solution)