Unlock a world of possibilities! Login now and discover the exclusive benefits awaiting you.
- Qlik Community
- :
- All Forums
- :
- Qlik NPrinting
- :
- How to associate a filter on a specific table in P...
- Subscribe to RSS Feed
- Mark Topic as New
- Mark Topic as Read
- Float this Topic for Current User
- Bookmark
- Subscribe
- Mute
- Printer Friendly Page
- Mark as New
- Bookmark
- Subscribe
- Mute
- Subscribe to RSS Feed
- Permalink
- Report Inappropriate Content
How to associate a filter on a specific table in Pixel Perfect report of Qlik NPrinting
- Mark as New
- Bookmark
- Subscribe
- Mute
- Subscribe to RSS Feed
- Permalink
- Report Inappropriate Content
Table and Image filtered objects are not supported directly in the NPrinting Pixel Perfect editor unfortunately.
These types of filters are a supported feature using the NP MS Office and HTML template editors however.
You may wish to consider using one of those template editors to meet your requirement then use PDF as an output format when you add this report to a publish task.
Hope this helps
Kind regards...
- Mark as New
- Bookmark
- Subscribe
- Mute
- Subscribe to RSS Feed
- Permalink
- Report Inappropriate Content
Hi Frank,
Thanks for your quick response. I'll try to make it in NP Ms office / HTML and use the output as a PDF report.
Let you know the status.
Regards,
Vara
- Mark as New
- Bookmark
- Subscribe
- Mute
- Subscribe to RSS Feed
- Permalink
- Report Inappropriate Content
Or you may want to create a dedicated object for your table which could be filtered from report /task level without affecting other objects (for example with use of set analysis and island tables, or If you wait for November 2019 version with variable filter...
- Mark as New
- Bookmark
- Subscribe
- Mute
- Subscribe to RSS Feed
- Permalink
- Report Inappropriate Content
Hi Frank,
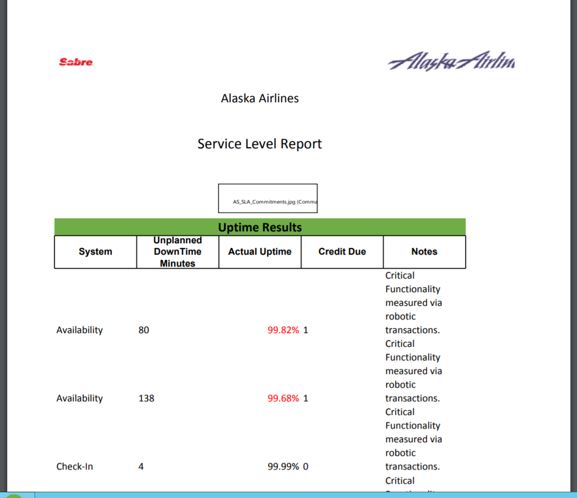
I did hardcoded three tables in Qliksense with respective of filters (Uptime, Resolution, Other) with calculated dimensions, made some expressions for Red color text values and percenatge(%) symbols which output is getting in Excel type of format in Nprinting, but the thing is getting below mentioned issues.
1. not getting proper alignment,
2. Not getting borders for field values
3. The headers, logos and striaght table fields are not repeating in continues pages.
4. Not getting images dynamically in Nprinting reports.
Request you to please look into these issues and help me out on this.
thanks a ton in advance.
Regards,
Vara
- Mark as New
- Bookmark
- Subscribe
- Mute
- Subscribe to RSS Feed
- Permalink
- Report Inappropriate Content
It's my weekend now but I was really interested in taking on this challenge so here is what you can do.
Since you can't use chart filtering in pixel perfect and also since you can't put charts side by side anyway, I found a workaround that will require that you create a single QS chart with can be used with your PxP report.
- Create a single QS chart
- Use at least 1 dimension (Use which ever dimensions that you wish to display).
- Create 3 measures using set analysis. In my example i used set analysis to show only data for a specific year.
- Column 2: sum( {$<Year={2017}>} Sales )
- Column 3: sum( {$<Year={2018}>} Sales )
- Column 4: sum( {$<Year={2019}>} Sales )
Now you have a single chart with 3 separate years that can be used in your pixel perfect report. (Note: Please remember to reload your NPrinting Connection to this Qlik Sense app before proceeding so that the new fields will become available to NPrinting).
So create your PxP report as usual using this newly created chart.
I have attached a copy of the QVF I created today as well as a sample report generated from this QVF with repeating headers and page breaks using group headers (repeat on every page check box option selected) and footers (break after the page option selected)
Hope this is a method that will work for you...unless someone else hear has a better option to help you to meet your requirement.
Kind regards....
- Mark as New
- Bookmark
- Subscribe
- Mute
- Subscribe to RSS Feed
- Permalink
- Report Inappropriate Content
Here is the report output as well.
You can used the Pixel Perfect editing tools to edit to your hearts content.
- Mark as New
- Bookmark
- Subscribe
- Mute
- Subscribe to RSS Feed
- Permalink
- Report Inappropriate Content
Hi Frank,
I sincerely thank you for your kind response on my query.
The fields i am using in Qliksense straight tables are already calculated fields and fetching from the data base directly.
we no need to do any transformations of these fields in QS App.
I have done hard coded one each and every table (3 tables) and puling to excel format in Nprinting.
but while converting into pdf report, the report is not getting with proper borders, headings and field names are not repeating into continues pages.
The major issue is that how to get dynamic images in Nprinting based on our selections.
Regards,
Vara
- Mark as New
- Bookmark
- Subscribe
- Mute
- Subscribe to RSS Feed
- Permalink
- Report Inappropriate Content
dynamic images was answered here:
and here
both seem to be duplication of the same post as well as this post.
Please try to focus on one topic at the time as community will not be able to benefit from topics created to solve multiple issues..
If you want to learn how to use dynamic images ask the question related to it, If you want to learn how to make sure the borders are properly created make separate question re this and provide sample/detailed screenshots of your template as this is where you are doing something wrong (read instructions on help.qlik.com which describes how properly built report template needs to look like)
https://help.qlik.com/en-US/nprinting/June2019/Content/NPrinting/ExcelReports/Excel-formatting.htm
when createing q question please spend time describing steps you are taking... screenshot your template, screenshot xls output, screenshot pdf output.
You are asking about borders not being populated in PDF...are they at least populated in XLS output?
regards
Lech