Unlock a world of possibilities! Login now and discover the exclusive benefits awaiting you.
- Qlik Community
- :
- All Forums
- :
- Qlik NPrinting
- :
- How to set the same max. & min. value for y-axis g...
- Subscribe to RSS Feed
- Mark Topic as New
- Mark Topic as Read
- Float this Topic for Current User
- Bookmark
- Subscribe
- Mute
- Printer Friendly Page
- Mark as New
- Bookmark
- Subscribe
- Mute
- Subscribe to RSS Feed
- Permalink
- Report Inappropriate Content
How to set the same max. & min. value for y-axis grid in NPrinting pixel perfect stacked graph
Hi all,
I have crate some native pixel perfect graphs in my Nprinting pixel perfect report.
Where I have placed 7-8 graphs in same level .
like this .
But y-axis grid of all the graphs are not same so, how can fix this?
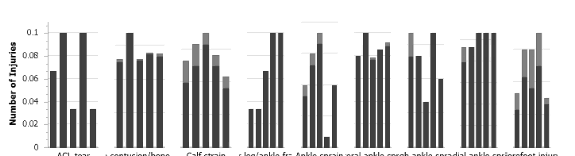
My output:-
you can see y-axis grids for all the graph are not parallel so want to make all of them as parallel.
expected output:-
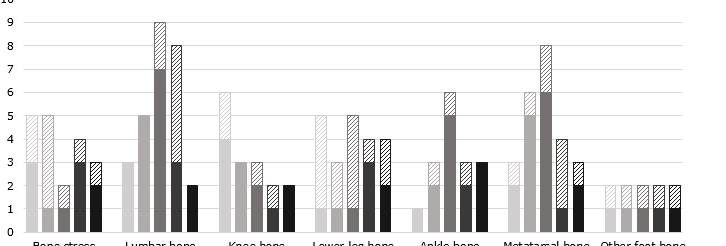
in this graphs you can see all the y-axis grids are parallel to each other. These all are separate graphs
- Mark as New
- Bookmark
- Subscribe
- Mute
- Subscribe to RSS Feed
- Permalink
- Report Inappropriate Content
Hello,
I'm not sure if you are using Qlik NPrinting with QlikView or Qlik Sense, and which version you are using, however, our help documentation has information on how to set the X and Y axis for PixelPerfect Reports.
Please see the following:
Thank you,
Eva