Unlock a world of possibilities! Login now and discover the exclusive benefits awaiting you.
- Qlik Community
- :
- All Forums
- :
- Qlik NPrinting
- :
- [NPrinting 16.6] Individual format for columns in ...
- Subscribe to RSS Feed
- Mark Topic as New
- Mark Topic as Read
- Float this Topic for Current User
- Bookmark
- Subscribe
- Mute
- Printer Friendly Page
- Mark as New
- Bookmark
- Subscribe
- Mute
- Subscribe to RSS Feed
- Permalink
- Report Inappropriate Content
[NPrinting 16.6] Individual format for columns in PowerPoint-Template
Hello,
I'm trying to create a table in PowerPoint which has different number formattings for each column. Unfortunatly I'm not very successful.
Disclaimer: I need both 'Format' and 'Custom Rows' which prevents me from inserting the individual columns instead of the whole table.
I'm using Nprinting 16.6.0.0 (SR6) with QlikView 12.10.20000.0 (SR2)
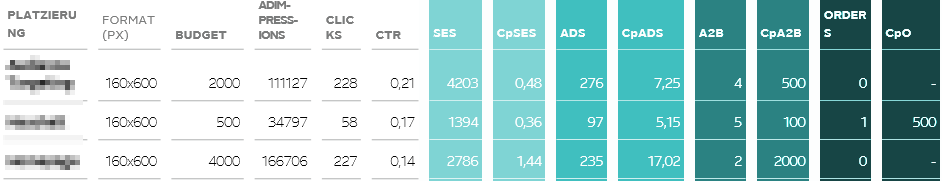
I'm getting following table
What I'm trying to get ist this table
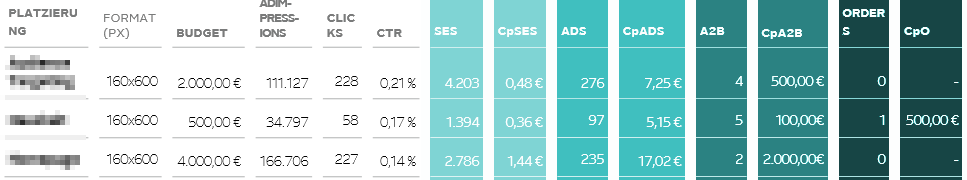
In the powerpoint template this table looks like the following

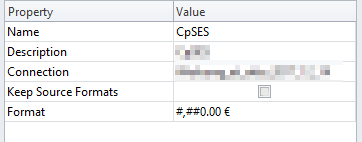
As an example the properties for the CpSES column
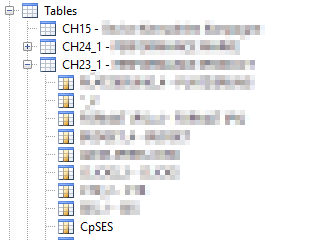
That's my structure. The table CH23_1 is the one I'm referring to in the powerpoint template. The column I'm trying to get into the format '#,##0.00 €' is CpSES.
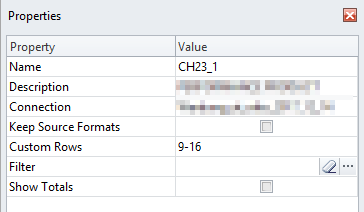
The properties for the CH23_1. I unchecked the 'Keep Source Formats'. As you can see I also specified 'Custom Rows'. As I read in the help.qlik.com section this setting is only available for whole tables and are not available for single columns. So I'm stuck with the whole table.
The properties for the CpSES column. 'Keep Source Formats' is also unchecked. The format is given.
As you may see in the desired table at the beginning of the post I want different formats for the individual columns. some are '#,##0', some are '#,##0.00 %' and some are '#,##0.00 €'.
Is it possible to achieve this or am I out of luck?
Accepted Solutions
- Mark as New
- Bookmark
- Subscribe
- Mute
- Subscribe to RSS Feed
- Permalink
- Report Inappropriate Content
The help page is either outdated or plain wrong. The individual formatting is working if you insert each column of the table on its position in the powerpoint. The 'Custom Rows' part is also working - despite being otherwise stated in the Qlik help page.
That was time not well spent...