Unlock a world of possibilities! Login now and discover the exclusive benefits awaiting you.
- Qlik Community
- :
- Forums
- :
- Analytics
- :
- App Development
- :
- Comparing years and months
- Subscribe to RSS Feed
- Mark Topic as New
- Mark Topic as Read
- Float this Topic for Current User
- Bookmark
- Subscribe
- Mute
- Printer Friendly Page
- Mark as New
- Bookmark
- Subscribe
- Mute
- Subscribe to RSS Feed
- Permalink
- Report Inappropriate Content
Comparing years and months
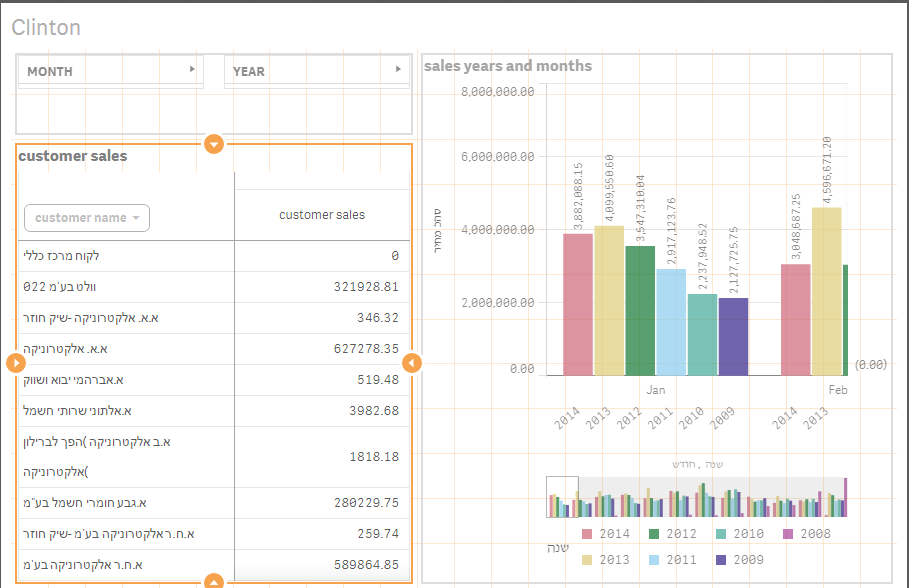
Hey I am trying to compare sales by years and months meaning
February 2014 sales vs February 2013 sales how can I preform this?
And how can I show it on percentages?
I am adding a picture of my app
- « Previous Replies
-
- 1
- 2
- Next Replies »
Accepted Solutions
- Mark as New
- Bookmark
- Subscribe
- Mute
- Subscribe to RSS Feed
- Permalink
- Report Inappropriate Content
No probelm,
So that would be :
1) sum(iv_cost) - assuming year 2014 is selected
2) sum({$< year = {'$(=num((GetFieldSelections(year) - 1), '###0' ))'}>} iv_cost)
- Mark as New
- Bookmark
- Subscribe
- Mute
- Subscribe to RSS Feed
- Permalink
- Report Inappropriate Content
go through
- Mark as New
- Bookmark
- Subscribe
- Mute
- Subscribe to RSS Feed
- Permalink
- Report Inappropriate Content
hey sureshqv , tnx for your help but i belive the soultion will be changing / applying things on the App itself....
- Mark as New
- Bookmark
- Subscribe
- Mute
- Subscribe to RSS Feed
- Permalink
- Report Inappropriate Content
i need the user to have the ability to change it manually...
- Mark as New
- Bookmark
- Subscribe
- Mute
- Subscribe to RSS Feed
- Permalink
- Report Inappropriate Content
Hi Jhonatan,
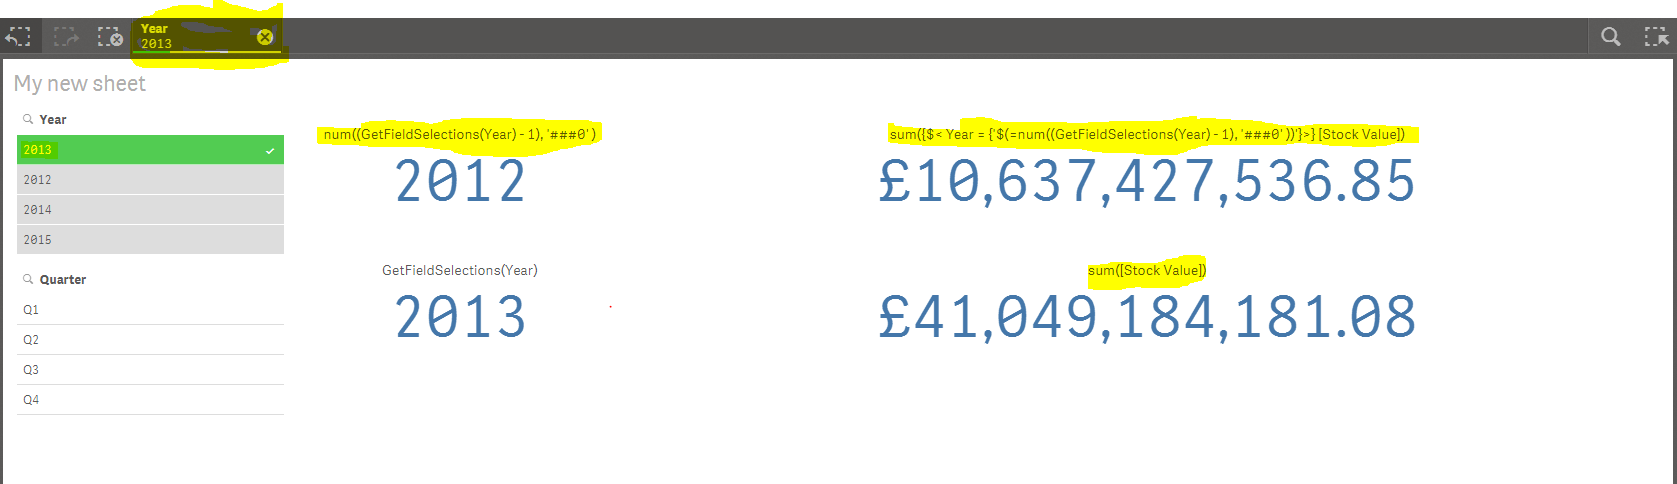
From the description of the problem, I think you need some thing like this. When 2014 and Feb is selected, the results should be compared to 2013 - Feb right?
If so check this out:

- Sangram
- Mark as New
- Bookmark
- Subscribe
- Mute
- Subscribe to RSS Feed
- Permalink
- Report Inappropriate Content
Exactly !! yes thats what i need how can i do it ?
- Mark as New
- Bookmark
- Subscribe
- Mute
- Subscribe to RSS Feed
- Permalink
- Report Inappropriate Content
Hi Jhonatan,
Just create two measures like this:
1) sum([Field])
2) sum({$< Year = {'$(=num((GetFieldSelections(Year) - 1), '###0' ))'}>} [Field])
Create these measure and make use of them in your chart.
As @sureshgv mentioned, the best practice is to do it in the script which gives you better performance.
Hope this helps!
- Sangram
- Mark as New
- Bookmark
- Subscribe
- Mute
- Subscribe to RSS Feed
- Permalink
- Report Inappropriate Content
if i have Sum(sales) as measure,
that means i have to put in the GetFieldSelections?
- Mark as New
- Bookmark
- Subscribe
- Mute
- Subscribe to RSS Feed
- Permalink
- Report Inappropriate Content
would mind to help me with syntax?
year=year
sales = sum ( iv_cost)
- Mark as New
- Bookmark
- Subscribe
- Mute
- Subscribe to RSS Feed
- Permalink
- Report Inappropriate Content
Hi Jhonatan,
Then just use these expressions:
1) sum(sales) - assuming year 2014 is selected
2) sum({$< Year = {'$(=num((GetFieldSelections(Year) - 1), '###0' ))'}>} sales) - this will give you the sum of sales for 2013 considering any other month or quarter selections as well.
- « Previous Replies
-
- 1
- 2
- Next Replies »