Unlock a world of possibilities! Login now and discover the exclusive benefits awaiting you.
- Qlik Community
- :
- Forums
- :
- Analytics
- :
- App Development
- :
- How to create box plot without measure or dimensio...
- Subscribe to RSS Feed
- Mark Topic as New
- Mark Topic as Read
- Float this Topic for Current User
- Bookmark
- Subscribe
- Mute
- Printer Friendly Page
- Mark as New
- Bookmark
- Subscribe
- Mute
- Subscribe to RSS Feed
- Permalink
- Report Inappropriate Content
How to create box plot without measure or dimension
I am working in Qlik Sense Enterprise February 2018. I need to create a box plot of raw data (no aggregations) and with no dimensions. That is, I need to create a box plot of all values in some numerical column. These numbers don't need to be aggregated (e.g., sum), and I don't need to group the data (i.e., no dimensions). Is this possible? I know that box plots -- just like most other visualizations in Qlik Sense -- require a measure and at least one dimension. So, I imagine that the solution would involve "faking" out the measure and dimension. I just don't know what that would look like. Or, perhaps, is it best to offload this situation to a different tool (e.g., R)?
- Tags:
- box plot
Accepted Solutions
- Mark as New
- Bookmark
- Subscribe
- Mute
- Subscribe to RSS Feed
- Permalink
- Report Inappropriate Content
Hi Casey,
I had a little play with some data here and it is possible using the raw field as both dimension and measure.
Here is what it looks like with the standard (tukey) settings..

and this one with the box plot settings changed to percentile-based and Min/Max whisker position.
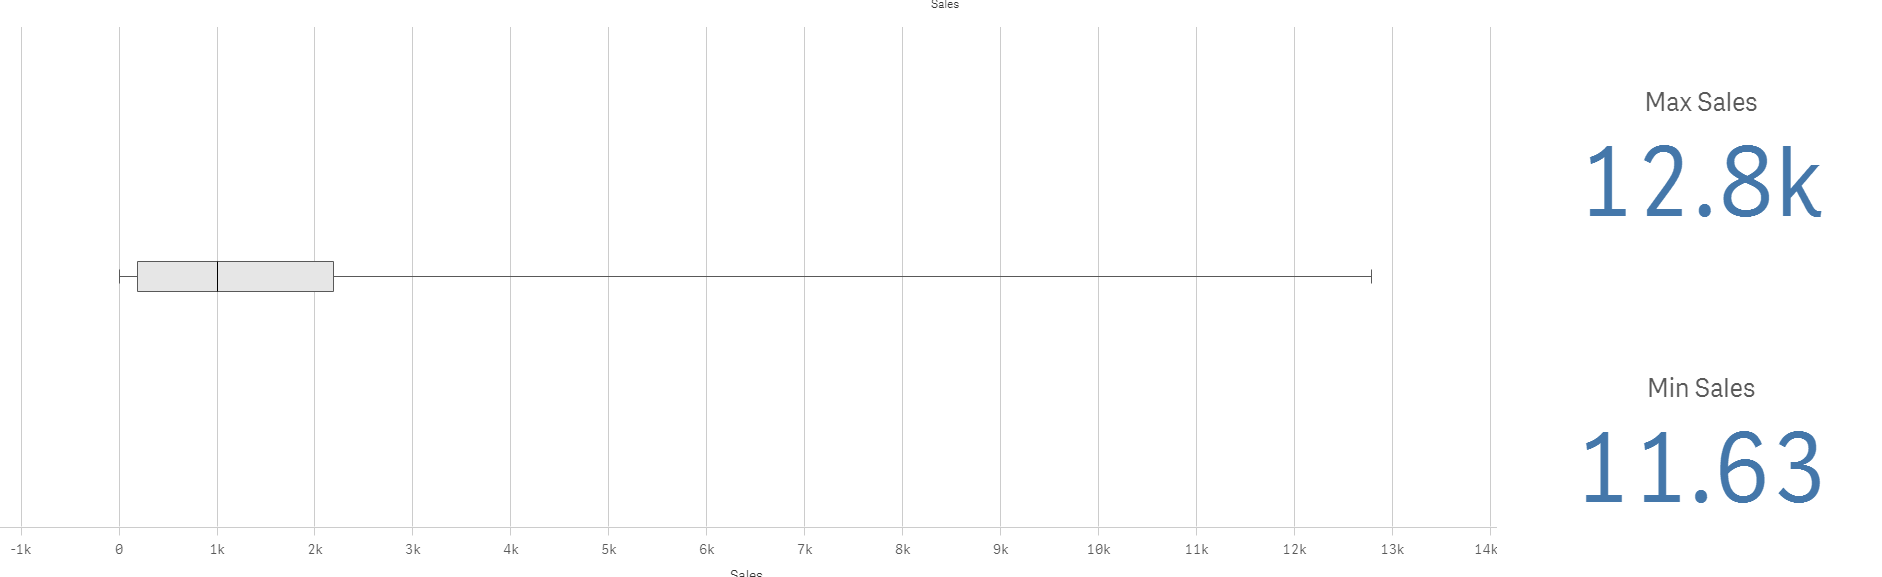
Hope this helps.
- Mark as New
- Bookmark
- Subscribe
- Mute
- Subscribe to RSS Feed
- Permalink
- Report Inappropriate Content
Hi Casey,
I had a little play with some data here and it is possible using the raw field as both dimension and measure.
Here is what it looks like with the standard (tukey) settings..
and this one with the box plot settings changed to percentile-based and Min/Max whisker position.
Hope this helps.