Unlock a world of possibilities! Login now and discover the exclusive benefits awaiting you.
- Qlik Community
- :
- Forums
- :
- Analytics
- :
- App Development
- :
- Trying to show Daily and Monthy Comparison between...
- Subscribe to RSS Feed
- Mark Topic as New
- Mark Topic as Read
- Float this Topic for Current User
- Bookmark
- Subscribe
- Mute
- Printer Friendly Page
- Mark as New
- Bookmark
- Subscribe
- Mute
- Subscribe to RSS Feed
- Permalink
- Report Inappropriate Content
Trying to show Daily and Monthy Comparison between Current Year and Previous Year in a Pivot table in QlikSense
Hi All,
I am trying to show Daily and Monthy Comparison between Current Year and Previous Year in a Pivot table in QlikSense.
We have all the Calendar fields (Date, Month, Year, Month-Year etc) in a dimension called DimDate. We have a Fact table storing the transactions. Date is common between DimDate and Fact.
I tried to show the following in Pivot table and did not succeed.
Month-Year
Date
Turnover
Turnover Last Year
I tried using set analysis, but did not succeed as the date related tables are present in the chart.
Is there a way do it?
Below is an example of How it should look like.
| Month | Date | Machine Turnover | Machine Turnover Last year | Variance |
| Jan-2017 | $10,754,608 | $10,753,452 | $1,156 | |
| Feb-2017 | $9,331,047 | $9,522,667 | -$191,620 | |
| Mar-2017 | $11,239,822 | $10,111,051 | $1,128,771 | |
| Apr-2017 | $10,341,098 | $10,613,375 | -$272,276 | |
| May-2017 | $11,166,579 | $9,722,408 | $1,444,171 | |
| Jun-2017 | $7,142,170 | $10,197,236 | -$3,055,067 | |
| (when expanded to date) | 01/06/2017 | $370,590 | $276,170 | $94,420 |
| 02/06/2017 | $829,450 | $601,126 | $228,324 | |
| 03/06/2017 | $1,250,095 | $1,048,779 | $201,316 |
- « Previous Replies
-
- 1
- 2
- Next Replies »
- Mark as New
- Bookmark
- Subscribe
- Mute
- Subscribe to RSS Feed
- Permalink
- Report Inappropriate Content
Hello Mahidhar,
Did you ever solve your problem?
I am attempting something similar, with
- SKU as a row.
- Invoice_Year as a column, which groups the measures for each year.
- Total_invoiced_this_year as measure.
- Total_invoiced_last_year as measure.
The expressions for current year and last year both produce the same value, and it is the correct value for the current year:
Sum(ItemSalesAmt)
Sum({$<Invoice_Year={"=only(Invoice_Year)"}>}ItemSalesAmt)
Sum({$<Invoice_Year={"=$(=max(Invoice_Year)-1)"}>}ItemSalesAmt)
All three produce the same result.
René
- Mark as New
- Bookmark
- Subscribe
- Mute
- Subscribe to RSS Feed
- Permalink
- Report Inappropriate Content
Qlik introduced Calendar measures into the tool itself and I found it easier to use than using a Date Dim, since a lot of the time intelligence calculations are already baked into the tool. Use the tool to create the calendar measures that you want. You can preview the set expression generated to see what it is doing under the hood. The only downside a see is that the aggregations are calculated on the fly, rather than pre-loaded when you use your own date dim. But if your fact dataset is not too big, it may be a good option. http://help.qlik.com/en-US/sense/3.2/Subsystems/Hub/Content/Measures/create-calendar-measure.htm
- Mark as New
- Bookmark
- Subscribe
- Mute
- Subscribe to RSS Feed
- Permalink
- Report Inappropriate Content
Hello Marco,
Thanks for your reply (although I'm not sure whether it be to me or to Mahidhar).
I am and have been using my own date calendar successfully for Invoice Date. It seems to be only with pivot tables that I run into complications...
However, I see that Calendar measures are a new thing, I will see whether I can find anything useful to apply to pivot tables.
René
- Mark as New
- Bookmark
- Subscribe
- Mute
- Subscribe to RSS Feed
- Permalink
- Report Inappropriate Content
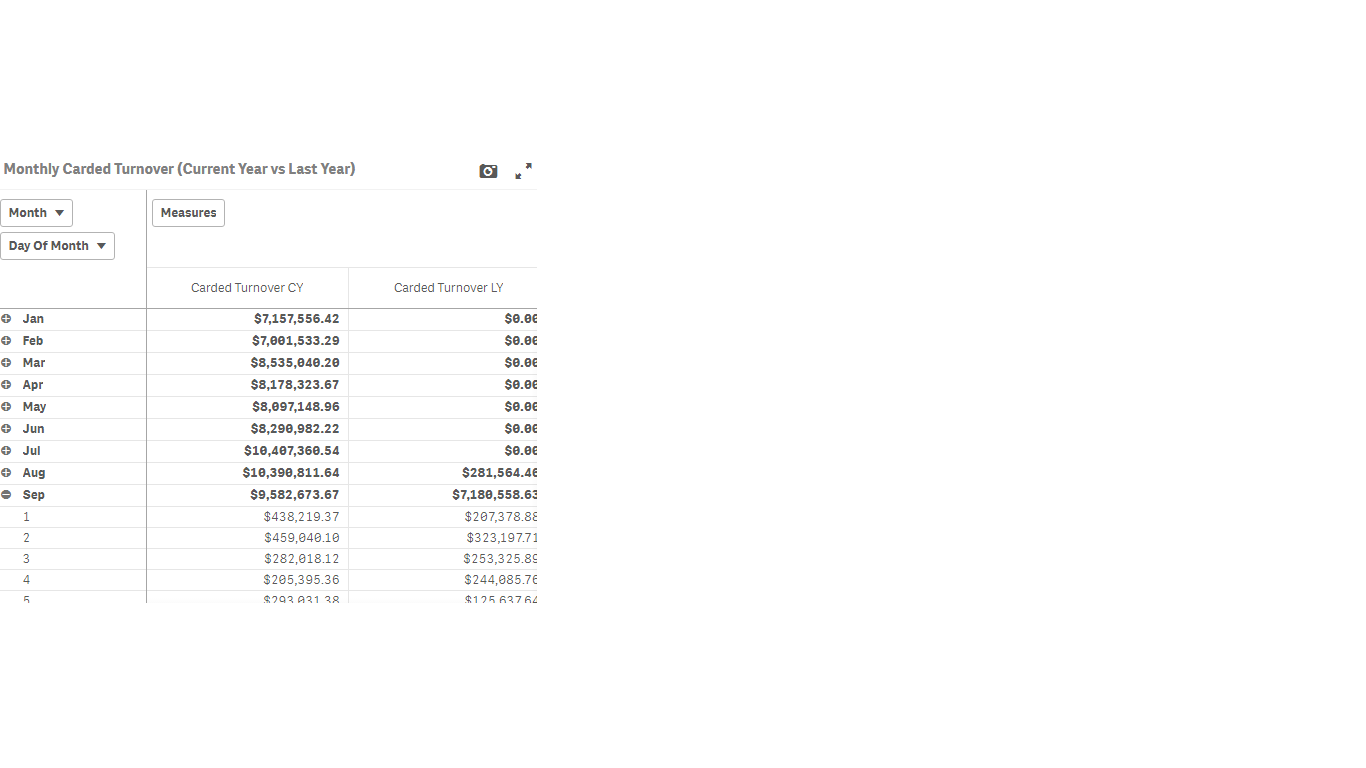
Hi Rene,
If you don't use Year in the Dimensions, it works. Below is the screenshot.
The moment, you introduce "Year" Dimension, it will restrict the calculation of the measure value based the dimension and you cannot have the current year and last year measures next to each other. That is the reason, I haven't used the Year Dimension. By name of the Measure, Current year and Last year Measures are identified.
Assuming that Year is a number like 2017 in your case as well, below should work for you:
For Current Year: Sum({$<Invoice_Year={$(=max(Invoice_Year))}>}ItemSalesAmt)
For Previous Year: Sum({$<Invoice_Year={$(=max(Invoice_Year)-1)}>}ItemSalesAmt)
Regards,
Mahi
- Mark as New
- Bookmark
- Subscribe
- Mute
- Subscribe to RSS Feed
- Permalink
- Report Inappropriate Content
try this
For Current Year: Sum({$<Invoice_Year={"$(=max(Invoice_Year))"}>}ItemSalesAmt)
For Previous Year: Sum({$<Invoice_Year={"$(=max(Invoice_Year)-1)"}>}ItemSalesAmt)
regards
Pradosh
- Mark as New
- Bookmark
- Subscribe
- Mute
- Subscribe to RSS Feed
- Permalink
- Report Inappropriate Content
Hello Mahidhar,
Thank you for your response. I had also tried your suggestion, but I tried again, with the same result:
What I tried:
Sum({$<Invoice_Year={"=$(=max(Invoice_Year)-1)"}>}ItemSalesAmt)
What you suggested:
Sum({$<Invoice_Year={ $(=max(Invoice_Year)-1) }>}ItemSalesAmt)
What Pradosh suggested:
Sum({$<Invoice_Year={" $(=max(Invoice_Year)-1)"}>}ItemSalesAmt)
With my formula, the result for last year was identical to the result for this year, is if it were misidentifying the current year's data as for the prior year.
[Edited]
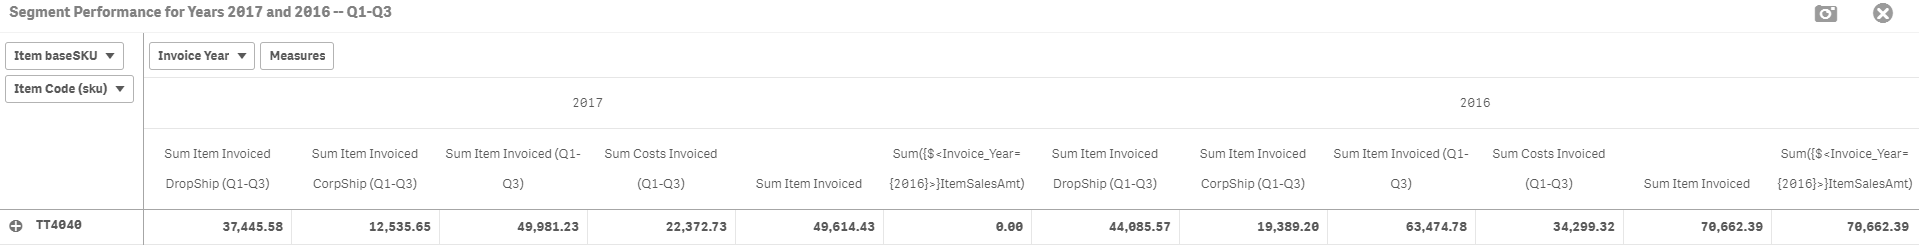
With your formula, as well as Pradosh's formula, the result was zero for 2017, as if for each column the data set in view were only for 2016 (because the formula always resolves the year to 2016, as can be seen from the heading), and so nothing from 2016 were found. But for the 2016 column, since that data is available, it was summed, showing that the formula is not adjusting to the context of the current value of the column but continues to calculate a result for 2016, which is the year in focus.
I am mystified.
René
- Mark as New
- Bookmark
- Subscribe
- Mute
- Subscribe to RSS Feed
- Permalink
- Report Inappropriate Content
Hello Pradosh,
Thank you for your response. I had also tried your suggestion, but I tried again, with the same result:

What I tried:
Sum({$<Invoice_Year={"=$(=max(Invoice_Year)-1)"}>}ItemSalesAmt)
What Mahidhar suggested:
Sum({$<Invoice_Year={ $(=max(Invoice_Year)-1) }>}ItemSalesAmt)
What you suggested:
Sum({$<Invoice_Year={" $(=max(Invoice_Year)-1)"}>}ItemSalesAmt)
With my formula, the result for last year was identical to the result for this year, is if it were misidentifying the current year's data as for the prior year.
[Edited]
With your formula, as well as Pradosh's formula, the result was zero for 2017, as if for each column the data set in view were only for 2016 (because the formula always resolves the year to 2016, as can be seen from the heading), and so nothing from 2016 were found.
For the 2016 column, in contrast to Mahi's formula, it remained zero, the reason for which I don't know.
I am mystified.
René
- Mark as New
- Bookmark
- Subscribe
- Mute
- Subscribe to RSS Feed
- Permalink
- Report Inappropriate Content
can you post a sample for use to try?
regards
Pradosh
- Mark as New
- Bookmark
- Subscribe
- Mute
- Subscribe to RSS Feed
- Permalink
- Report Inappropriate Content
Hello Pradosh,
>> can you post a sample for use to try?
I will see. The data is sensitive, and I would need to restrict the load, but it may be possible.
In the meantime, please note the correction in my prior response to you.
Thanks!
René
- « Previous Replies
-
- 1
- 2
- Next Replies »