Unlock a world of possibilities! Login now and discover the exclusive benefits awaiting you.
- Qlik Community
- :
- Forums
- :
- Forums by Product
- :
- Products (A-Z)
- :
- Qlik Sense
- :
- Documents
- :
- Calculating trend lines, values and formulas on ch...
- Move Document
- Delete Document
- Subscribe to RSS Feed
- Mark as New
- Mark as Read
- Bookmark
- Subscribe
- Printer Friendly Page
- Report Inappropriate Content
Calculating trend lines, values and formulas on charts and tables in Qlik Sense
- Move Document
- Delete Document and Replies
- Mark as New
- Bookmark
- Subscribe
- Mute
- Subscribe to RSS Feed
- Permalink
- Report Inappropriate Content
Calculating trend lines, values and formulas on charts and tables in Qlik Sense
I spent a little time working through the formulas required to mimic the trend lines that are available in QlikView and currently not available in Qlik Sense without knowing how to write reasonably complex expressions.
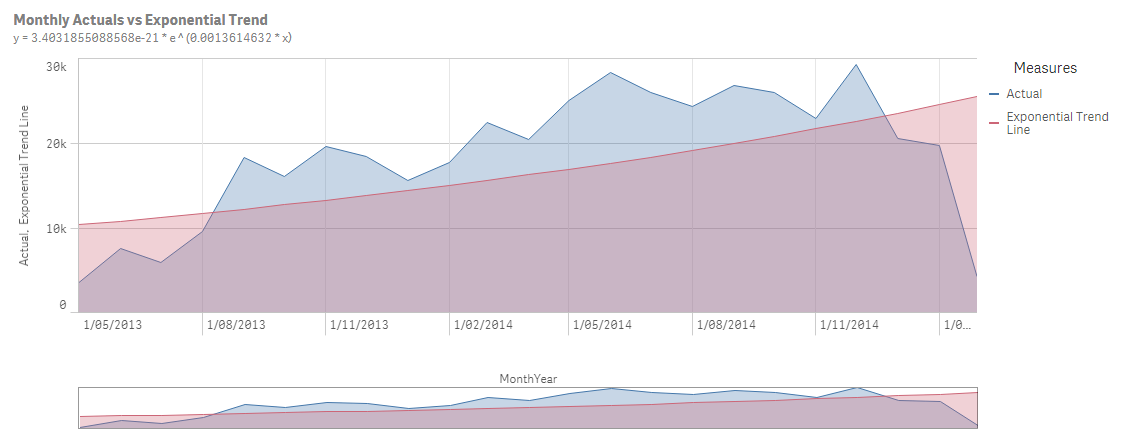
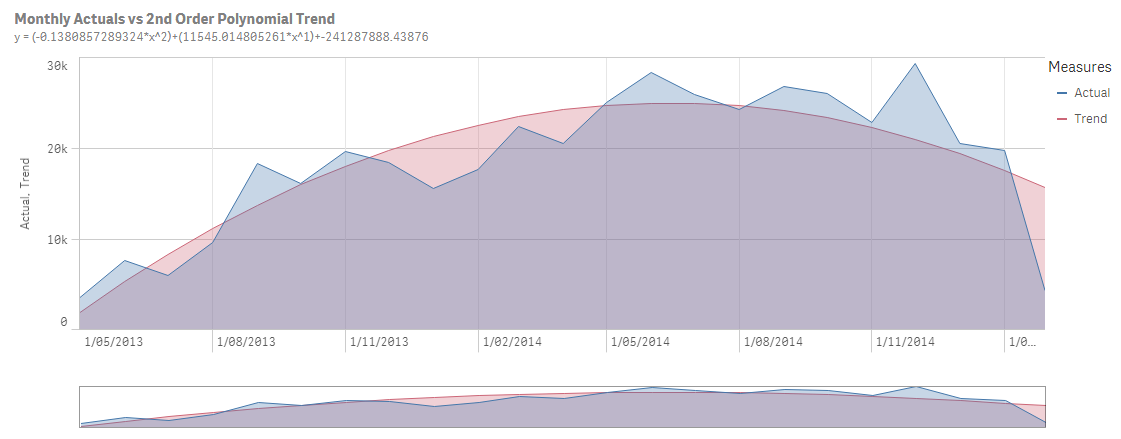
Here are some examples of exponential and 2nd order polynomial trend lines with the relationship expressed as a formula in the subtitle.
Exponential Trend Line
2nd order polynomial trend line
To make things as clear as possible I have included the Excel variants of these formulas so you have something to reference as I have done whilst checking these formulas calculate correctly. These excel formulas were sourced from Excel Tips From John Walkenbach: Chart Trendline Formulas
The below table shows the equivalent formulas in Qlik for the excel formulas provided. I have also attached a QVF file with examples of each one so that you have something real to reference as you build these into your own applications. In addition I have included the excel file that I was using for testing to ensure my calculations were correct.
Excel Formulas | Qlik Formulas | |
|---|---|---|
Linear Trendline | ||
| Equation | y = m * x + b | y = m * x + b |
| m | = SLOPE(y,x) | = LINEST_M(y,x) |
| b | = INTERCEPT(y,x) | = LINEST_B(y,x) |
Logarithmic Trendline | ||
| Equation | y = (c * LN(x)) + b | y = (c * LOG(x)) + b |
| c | = INDEX(LINEST(y,LN(x)),1) | = LINEST_M(y,LOG(x)) |
| b | = INDEX(LINEST(y,LN(x)),1,2) | = LINEST_B(y,LOG(x)) |
Power Trendline | ||
| Equation | y=c*x^b | y = c * POW( x , b) |
| c | = EXP(INDEX(LINEST(LN(y),LN(x),,),1,2)) | = EXP(LINEST_B(LOG(y),LOG(x))) |
| b | = INDEX(LINEST(LN(y),LN(x),,),1) | = LINEST_M(LOG(y),LOG(x)) |
Exponential Trendline | ||
| Equation | y = c *e ^(b * x) | y = c * POW( e , b * x) |
| c | = EXP(INDEX(LINEST(LN(y),x),1,2)) | = EXP(LINEST_B(LOG(y),x)) |
| b | = INDEX(LINEST(LN(y),x),1) | = LINEST_M(LOG(y),x) |
| e | = EXP(1) | = e() |
| 2nd order Polynomial Trend | ||
| Equation | y = (c2 * x^2) + (c1 * x ^1) + b | y = (c2 * POW(x,2)) + (c1 * x) + b |
| c2 | = INDEX(LINEST(y,x^{1,2}),1) | see example - variable c2 |
| c1 | = INDEX(LINEST(y,x^{1,2}),1,2) | see example - variable c1 |
| b | = INDEX(LINEST(y,x^{1,2}),1,3) | see example - variable b |
Points to note:
- You will see in the QVF that I have used monthly aggregated values from more detailed data which is a real life requirement (you would not necessarily want to create an aggregated table just for this purpose). Therefore the Y values are shown aggregated by the dimension. i.e. aggr(Sum([Expenses (USD)]),MonthYear)
- The 2nd Order Polynomial trend is a little more complex than the others. I have not found a comparable function to excel LINEST(Y,x^{1,2}) so have managed to find some old examples and put together a longhand version. Please see the variables in the example application.
- The 2nd Order Polynomial dimension has some specific requirements in the current form of the expressions. It MUST be a field with distinct values in the dataset, i.e. MonthYear in my example must have the grain of MonthYear and not be a field in the calendar table. It should also join directly to the fact where actuals reside, not join through another dimension.
- Move Comment
- Delete Comment
- Mark as Read
- Mark as New
- Bookmark
- Permalink
- Report Inappropriate Content
Thanks, this is really useful.
- Move Comment
- Delete Comment
- Mark as Read
- Mark as New
- Bookmark
- Permalink
- Report Inappropriate Content
Sorry for my English.
Can it be more accurate?
linest_m(total aggr(sum(Expenses),MonthYear),(Aggr(Log(Rowno()) * MonthYear, MonthYear)))
* (Aggr(Log(Rowno()) * MonthYear, MonthYear))
+ linest_b(total aggr(sum(Expenses),MonthYear),(Aggr(Log(Rowno()) * MonthYear, MonthYear)))
- Move Comment
- Delete Comment
- Mark as Read
- Mark as New
- Bookmark
- Permalink
- Report Inappropriate Content
Hi Andy,
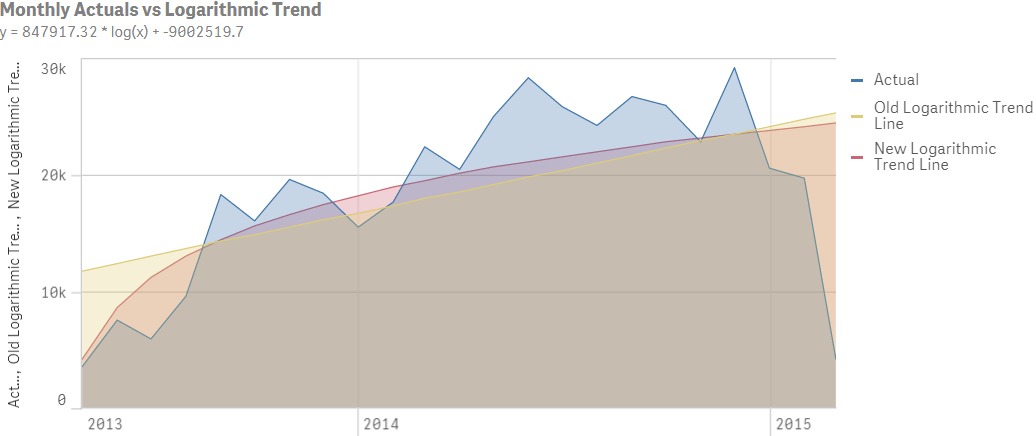
Great to share different options so we can find the best fit for our needs but I'd be cautious with your use of the term 'accurate'. To me the yellow line is more representative of the trend than the red one but that is subjective...
If you solve the 3rd an 4th order polynomial lines please let me know as this was a step too far for me 😉
Cheers
Richard
- Move Comment
- Delete Comment
- Mark as Read
- Mark as New
- Bookmark
- Permalink
- Report Inappropriate Content
Hi Richard,
Thanks for your solution on the 2nd order polynomial. In your comments you wrote that there is no equivalent INDEX(y,x^{1\2},1). I'm not sure if you already know that {1\2} is an extra x -column. For example:
LINEST_M equals the LINEST function in Excel.
for the following table:
| Y value | X value |
| 0,6931 | 1 |
| 0,7581 | 2 |
| 0,7553 | 3 |
the LINEST(Y:Y, X:X) = 0.0311. Same goes for LINEST_M in Qlik.
Adding the ^{1\2] leads to the following table in Excel (first x^1 and second x^2)
| Y value | X value | X-2 value |
| 0,6931 | 1 | 1 |
| 0,7581 | 2 | 4 |
| 0,7553 | 3 | 9 |
With LINEST(Y:Y ; X:X-2) you'll get -0.0399 which is your C2 value.
So the LINEST_M in Qlik comes close to the LINEST function in Excel only I don't exactly know how to get two X-columns into the LINEST_M function. Maybe you are able to figure it out.
If you already knew about the two X-columns than you can ignore my post of course.
Anyway thank you very much for the calculations.
- Move Comment
- Delete Comment
- Mark as Read
- Mark as New
- Bookmark
- Permalink
- Report Inappropriate Content
Hi all,
in a scatterplot where my measures are y=sum(sales) and x=sum(profit) and i have one dimension
my linear regression line would be
linest_m(total aggr(sum(sales),dimension)), aggr(sum(profit),dimension)) * sum(profit) + linest_b(total aggr(sum(sales),dimension)), aggr(sum(profit),dimension)) ?
- Move Comment
- Delete Comment
- Mark as Read
- Mark as New
- Bookmark
- Permalink
- Report Inappropriate Content
This is very useful; thank you!
I have a question though, do you know how to calculate the 3rd Order Polynomial? Any idea please?
- Move Comment
- Delete Comment
- Mark as Read
- Mark as New
- Bookmark
- Permalink
- Report Inappropriate Content
@richbyard great - thank you.
Have you already tried to calculate c2, c1 and b for 2nd order Polynomial Trend in the data editor/script?
For the Linear Trend it works fine to calculate m and b in script.