Unlock a world of possibilities! Login now and discover the exclusive benefits awaiting you.
Recent Documents
-
Creating a Gantt Chart in Qlik Sense
NOTE: The Qlik Help Channel on YouTube has the latest and greatest how-to's for the latest releases. Don't forget about the Qlik Online Help as well. ... Show MoreNOTE: The Qlik Help Channel on YouTube has the latest and greatest how-to's for the latest releases.
Don't forget about the Qlik Online Help as well. It has videos, samples, tutorials and more.How we can creating a gantt chart in qlik Sense without use any extension .
Ex: we can also create gantt chart in qlik Sense through anychart extension .

-
List and kill Qlik Sense Enterprise Sessions
This powershell script is capable of listing all active sessions of all virtual proxies. Then you can choose a session to terminate (if you want) I'v... Show More -
Digitizing floor plans for use in Qlik GeoAnalytics (QGA)
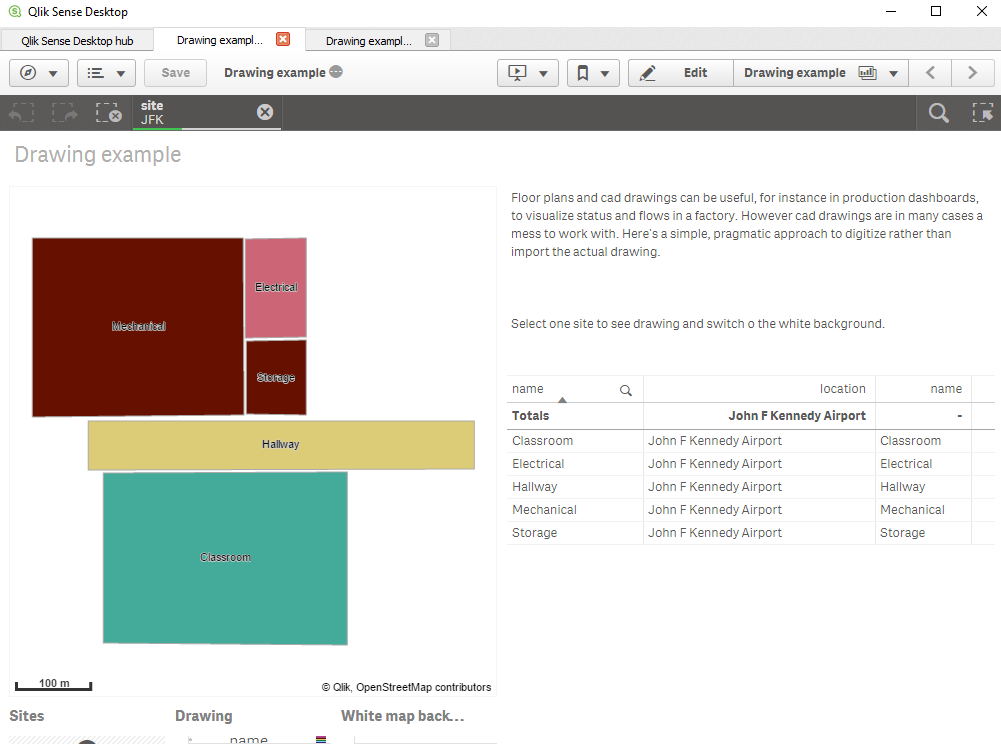
Update, the example app now have the drawing as a background.Floor plans and cad drawings can be useful, for instance in production dashboards, to vis... Show MoreUpdate, the example app now have the drawing as a background.
Floor plans and cad drawings can be useful, for instance in production dashboards, to visualize status and flows in a factory. However cad drawings are in many cases a mess to work with.
Here's a simple, pragmatic approach to digitize rather than import the actual drawing. The major issue with most CAD drawings is lack of structure, details without meaning and the objects on the right level are missing. It’s not the format or alignment that is the problem. In many cases it's better to use the drawing as a input to produce the polygons and information needed.
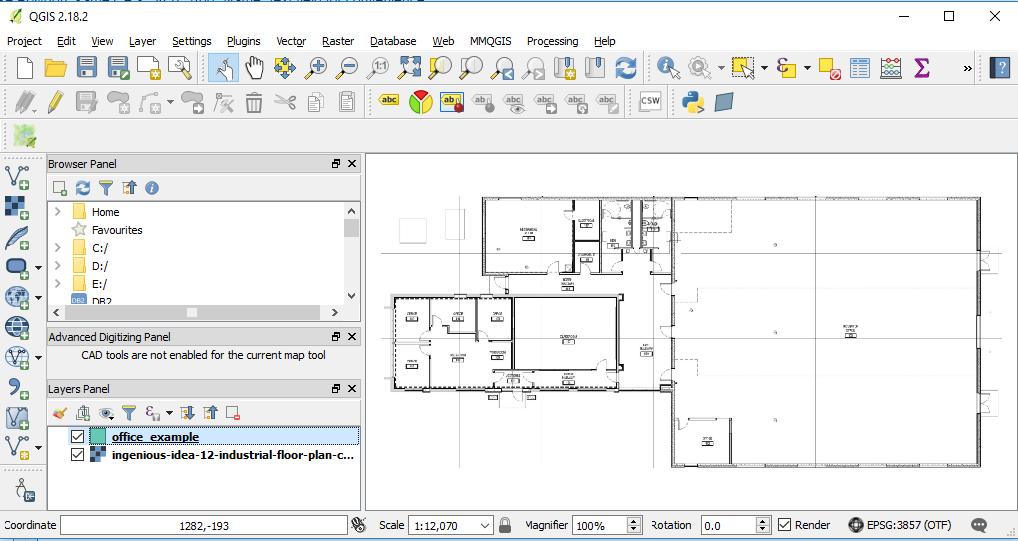
In this tutorial I use QGIS for digitizing and out put to a format that is easy to import to QGA. In this example the drawing is digitized in a local reference system, ie no alignment is made with the rest of the world.
Step-by-step guide
- Install QGA basic, Plus not needed if Dropbox et al is used.
- Install QGIS (https://www.qgis.org)
- Get a picture of the floor plan in an image format like PNG or JPG.
- Drag and drop the image to the layers panel of QGIS. Choose a meter based Coordinate Reference System, for instance EPSG:3857 is a good choice.
- Layer→ Create Layer→ New Shapefile Layer... Choose Polygon, same CRS, 3857. Add "Name" text field for convenience.

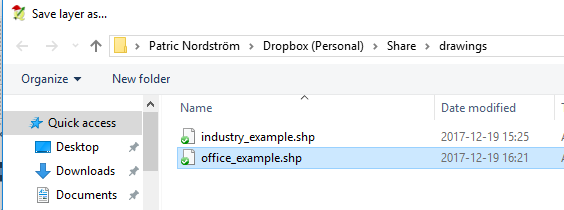
- Save layer in a folder. Preferable in dropbox folder.
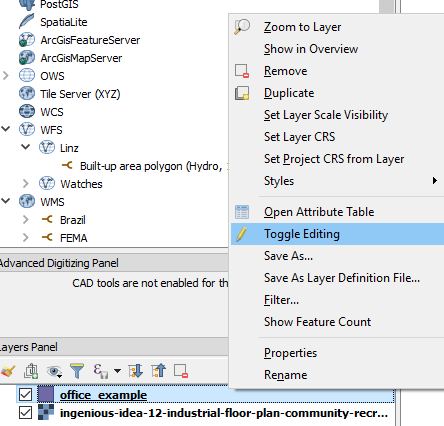
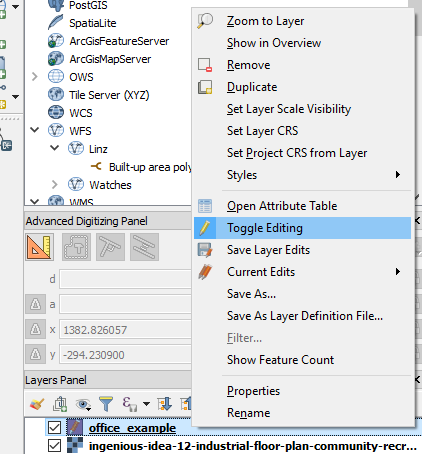
- Right click on the new polygon layer and "Toggle editing" to start editing.
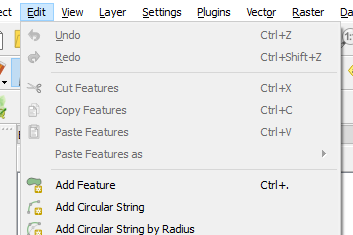
- Start adding features (Ctrl +)
- Click on the edges of the desired polygon, set id and name. Use node tool if fine tuning of edges is necessary.

- When done "Toggle editing"to save.
- Zip the shapefile to an archive and get the dropbox url. (replace www with dl to get direct link)
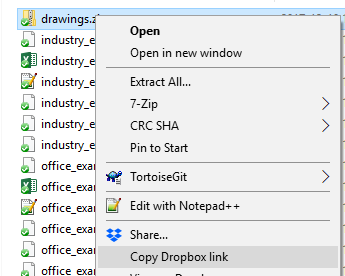
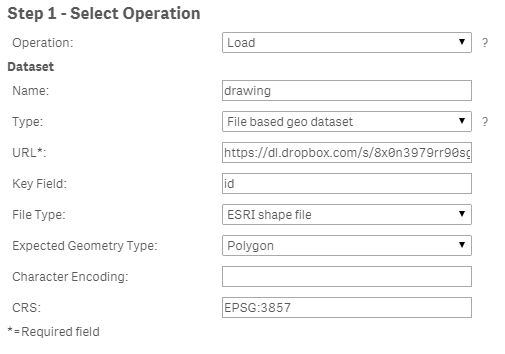
- Create a new Sense app and use the drop url in the Load operator of QGA connector. CRS: EPSG:3857. Note change url from 'www' to 'dl' for direct file access in dropbox.
Example app
The example app features sites and a drawing visible when one site is selected.
If you want to add and image background, here's how to scale and translate the image, in my example:
 Tip 1: get a white background use ='[[ [-180, -80], [-180, 80], [ 180, 80], [ 180, -80], [-180, -80] ]]' for location, set color to white and make the layer non selectable and not part of autozoom.Tip 2, Use a bubble layer with coordinates for different sites, when one site is selected turn on drawing and the white background.
 -
Qlik Explorer for Developers
Qlik Explorer for Developers is a light weight tool designed to provide a simple way for developers to examine the contents of a Qlik Sense server. T... Show More
-
How to access QRS (Repository) from Load Script
(Qlik Sense Server only, Qlik Sense Desktop has no Repository)There are situations where you would like to know something from the system configuratio... Show More(Qlik Sense Server only, Qlik Sense Desktop has no Repository)
There are situations where you would like to know something from the system configuration (QMC) from inside of a load script, something like "Which custom attributes does my app have assigned?" Or "Which stream is the current app in?" I've seen the "bad" idea to connect to the Postgre repository database and read from the internal table structure. This internal structure may, and is likely to, change, so I would not build on this hack.
The correct way to do it is to use the QRS API (Qlik Repository Service). In theory, the QRS API operates on the https port 443 as well as on port 4242. If you used the latter, you have to present the public key of the server certificate, which cannot be done from the load script (remark added 2020: the REST Connector meanwhile allows to add a Certificate File and Key File, so you can setup a connection directly to port 4242 when allowed from a firewall point of view).
In order to use the port 443, you need to authenticate as a privileged user towards the server - your best bet from the script is to use the header authentication (pass the userid via http-header) and this requrires the setup of a Virtual Proxy on the server by a QMC admin.
- Setup a new Virtual Proxy with Header Authentication
- Use Postman or another tool to test the qrs endpoint response before going to the load script
- Load Script: Use REST Connector with CONNECTION parameter
Step 1 - Setup Virtual Proxy
We want the script to be able to query the QRS api, so we have to give it a new "door" to authenicate. Set up a new Virtual Proxy like this: There will be a static pseudo user directory which we call "APIUSERS", whereas the user id itself will be provided in a http-header.
![2018-10-08 10_14_24-qmi-qs-aai [wird ausgeführt] - Oracle VM VirtualBox.png](/legacyfs/online/215313_2018-10-08 10_14_24-qmi-qs-aai [wird ausgeführt] - Oracle VM VirtualBox.png)
Dont forget to
- add the Server node(s) under "Load balancing"
- link this virtual proxy to a Proxy in the "Associated Items".
![2018-10-08 10_24_07-qmi-qs-aai [wird ausgeführt] - Oracle VM VirtualBox.png](/legacyfs/online/215327_2018-10-08 10_24_07-qmi-qs-aai [wird ausgeführt] - Oracle VM VirtualBox.png)
Note: We will have to come back to QMC/Users once again after making the first call using the header.
Step 2 - Test the qrs endpoint with header authentication
It is literally impossible to go straight to the REST connector from the script if you haven't tried the results from a tool that shows all response details (return code, possible error messages etc). My tool of choice is "Postman" (the app, not the Chrome-Plugin of the same name)
Lets use the server url + /header/ (this is the virtual proxy we created) + /qrs/about + &xrfkey= and a 16 digit combination, which you repeat in the http-headers under the key "X-Qlik-xrfkey" again. Also provide the userid as a 2nd http-header
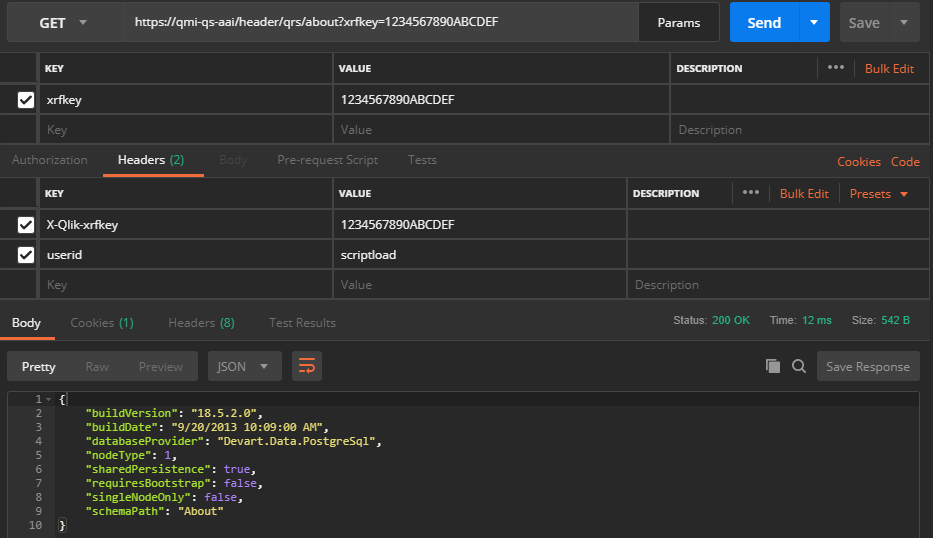
You should get an answer like above in Json format. This means, you made it through the virtual proxy. A new user has been added to the QMC, namely the id "scriptload" (coming from the http-header) with the directory "APIUSERS" (coming from the virtual proxy setting).
Go back to the QMC and provide the new user the Role "AuditAdmin"
![2018-10-08 10_41_01-qmi-qs-aai [wird ausgeführt] - Oracle VM VirtualBox.png](/legacyfs/online/215330_2018-10-08 10_41_01-qmi-qs-aai [wird ausgeführt] - Oracle VM VirtualBox.png)
Now you can also query some details about the app. Try the following request, before we finally go to the Load Script. -.../qrs/app/full should provide all information about apps, including possible tags.
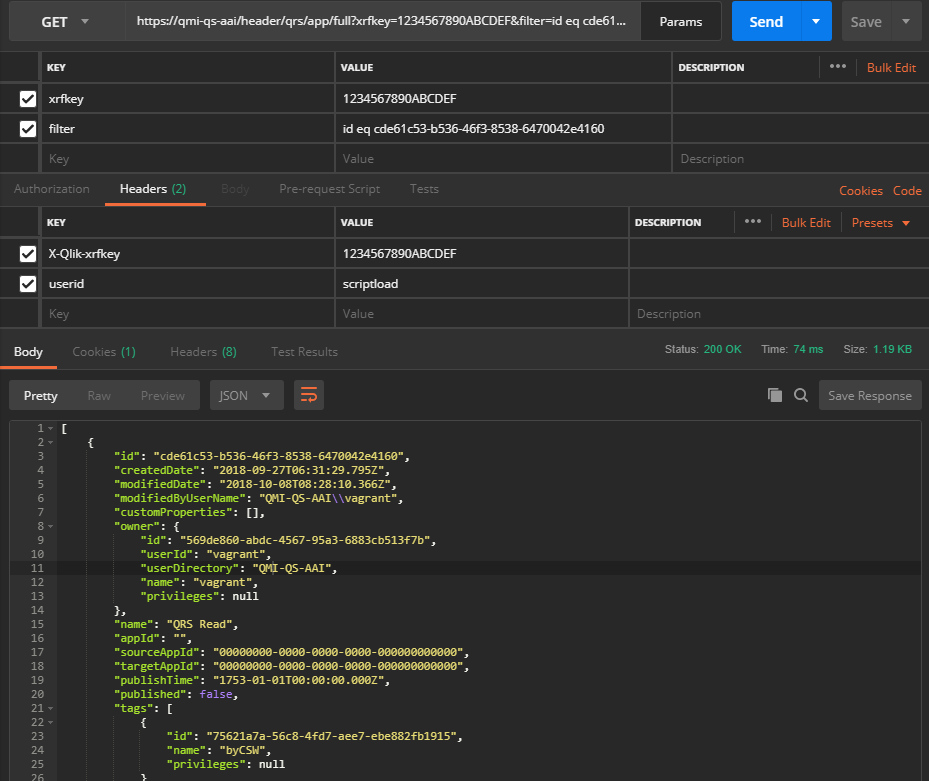
In order to get the details about one specific app you should use the "filter=" query-string, the syntax is like the Json object key, a comparison operator, and a constant. In my case: id eq <app-guid>
eq is "equals", don't use "=" which is a reserved character already used at "filter="
If this works fine, lets edit the app script.
3 - Create REST Connector call from Load Script
Go to the app's dataload editor and create a new connection of type "REST".
The principle I follow here is:
- get over the initial dialog with hard-coded query-strings and http-headers to get the qrs call working (same Method as later, GET for GET, POST for POST)
- load the data once
- manipulate the created script with "WITH CONNECTION" argument and soft-code all the parameters to make it dynamic
Then load the data using the "Select Data" button in the Data connections list:
![2018-10-08 11_01_32-qmi-qs-aai [wird ausgeführt] - Oracle VM VirtualBox.png](/legacyfs/online/215332_2018-10-08 11_01_32-qmi-qs-aai [wird ausgeführt] - Oracle VM VirtualBox.png)
You can expand the Json response tree and deselect what you don't need. Be aware that each tree branch, which expands, will become a separate script table, so be conservative with what to load using a "need to know" judgement.
![2018-10-08 10_59_52-qmi-qs-aai [wird ausgeführt] - Oracle VM VirtualBox.png](/legacyfs/online/215333_2018-10-08 10_59_52-qmi-qs-aai [wird ausgeführt] - Oracle VM VirtualBox.png)
Insert the script. You will see the block called "RestConnectorMasterTable: SQL SELECT ..." and then several LOAD statements (in our case 4, one for the root and 3 childs which we selected above)
Until this point, the script is fully static. It only loads exactly this QRS endpoint and always load all apps.
Now lets bring some dynamics in. Find the last row of the first block where it reads FROM JSON (...) "root" PK "__KEY_root";
![2018-10-08 11_06_55-qmi-qs-aai [wird ausgeführt] - Oracle VM VirtualBox.png](/legacyfs/online/215334_2018-10-08 11_06_55-qmi-qs-aai [wird ausgeführt] - Oracle VM VirtualBox.png)
Before the semicolon insert (in a new line) WITH CONNECTION ()
With this parameter you can soft-code and overwrite any hard-coded entry from the "Edit Connection" dialog. If you omit a parameter in WITH CONNECTION, the original hard-coded entry from the Edit Connection dialog will be taken. You can also add more parameters using WITH CONNECTION. Use the WITH CONNECTION script as follows:
- If you want to overrule the endpoint address use URL "https://...." option
- If you want to add another Query-string (filter for example) use QUERY "filter" "id eq cde61c53-b536-46f3-8538-6470042e4160" (QUERY takes 2 more parameters, key and value)
- If you want to add another header-key use HTTPHEADER
- Note: You can NOT change the method (GET/POST), you need another data connection if you have to use the other
Here is my example of getting the info just for the current app:
Add this row before the "LIB CONNECT TO ..." statement:
LET vAppId = DocumentName();
This will assign the app GUID to the variable.
Modify the last row of the first block as follows:
FROM JSON (wrap on) "root" PK "__KEY_root"
WITH CONNECTION (
URL "https://qmi-qs-aai/header/qrs/app/full"
,QUERY "filter" "id eq $(vAppId)"
);
Note: the variable $(AppId) is slided into the filter. QUERY xrfkey;
When you execute the script, you will get the app info from the QRS API loaded as a table datamodel:
![2018-10-08 11_28_40-qmi-qs-aai [wird ausgeführt] - Oracle VM VirtualBox.png](/legacyfs/online/215335_2018-10-08 11_28_40-qmi-qs-aai [wird ausgeführt] - Oracle VM VirtualBox.png)
Now you can use some of your scripting skills to get, for example, to check which tags the given app has and do something:
FOR v = 1 TO FieldValueCount('name_u0')
LET vTag = FieldValue('name_u0', 1);
IF vTag LIKE 'byCSW' THEN
TRACE --- this app has the tag of the tags ---;
END IF
NEXT v
More Advanced Script Example or QRS API
In the following example I am loading the list of all tasks for a given app. For the tasks I also want a 1:n-List of Custom Properties (if any) and Tags (if any). The returned Json structure would be complex (8 tables for the qrs endpoint /qrs/reloadtask/full):
![2018-10-08 14_22_37-qmi-qs-aai [wird ausgeführt] - Oracle VM VirtualBox.png](/legacyfs/online/215361_2018-10-08 14_22_37-qmi-qs-aai [wird ausgeführt] - Oracle VM VirtualBox.png)
Deselect what you don't need. I also unchecked a lot of unneeded columns. You better spend a few minutes in the "select data" dialog of the Data Connector than in the script below. To see which fields I skipped I commented them out in the code below. I also introduced "nice field names" like "tag.name" or "task.id" instead of auto-generated names such as "name_u4", "id_u6" ...
Finally, I joined some tables to have only 3 relevant ones after this.
![2018-10-08 14_17_13-qmi-qs-aai [wird ausgeführt] - Oracle VM VirtualBox.png](/legacyfs/online/215360_2018-10-08 14_17_13-qmi-qs-aai [wird ausgeführt] - Oracle VM VirtualBox.png)
Here is the sample script:
LET vAppId = DocumentName();
LET vXrfkey = Left(KeepChar(Repeat(Rand(),10),'0123456789'), 16);
TRACE Onetime Xrfkey = $(vXrfkey);
LIB CONNECT TO 'QRS full app info (qmi-qs-aai_vagrant)';
RestConnectorMasterTable:
SQL SELECT
"id" AS "id_u6",
// "createdDate" AS "createdDate_u0",
// "modifiedDate" AS "modifiedDate_u0",
// "modifiedByUserName" AS "modifiedByUserName_u0",
// "isManuallyTriggered",
"name" AS "name_u2",
"taskType",
"enabled",
// "taskSessionTimeout",
// "maxRetries",
// "privileges" AS "privileges_u5",
// "schemaPath" AS "schemaPath_u0",
"__KEY_root",
(SELECT
// "id" AS "id_u0",
// "createdDate",
// "modifiedDate",
// "modifiedByUserName",
"value",
// "schemaPath",
"__KEY_customProperties",
"__FK_customProperties",
(SELECT
// "id",
"name",
// "valueType",
// "privileges",
"__KEY_definition",
"__FK_definition"
FROM "definition" PK "__KEY_definition" FK "__FK_definition")
FROM "customProperties" PK "__KEY_customProperties" FK "__FK_customProperties"),
(SELECT
"id" AS "id_u1",
"name" AS "name_u0",
// "appId",
// "publishTime",
// "published",
// "stream",
// "savedInProductVersion",
// "migrationHash",
// "availabilityStatus",
// "privileges" AS "privileges_u0",
"__FK_app"
FROM "app" FK "__FK_app"),
(SELECT
// "id" AS "id_u5",
"name" AS "name_u1",
// "privileges" AS "privileges_u4",
"__FK_tags"
FROM "tags" FK "__FK_tags")
FROM JSON (wrap on) "root" PK "__KEY_root"
WITH CONNECTION (
URL "https://qmi-qs-aai/header/qrs/reloadtask/full"
,QUERY "filter" "app.id eq $(vAppId)"
,QUERY "xrfkey" "$(vXrfkey)"
,HTTPHEADER "X-Qlik-Xrfkey" "$(vXrfkey)"
// ,HTTPHEADER "userid" "scriptload"
);
[root]:
LOAD
[id_u6] AS [task.id],
// [createdDate_u0] AS [createdDate_u0],
// [modifiedDate_u0] AS [modifiedDate_u0],
// [modifiedByUserName_u0] AS [modifiedByUserName_u0],
// [isManuallyTriggered] AS [isManuallyTriggered],
[name_u2] AS [task.name],
[taskType] AS [task.taskType],
[enabled] AS [task.enabled],
// [taskSessionTimeout] AS [taskSessionTimeout],
// [maxRetries] AS [maxRetries],
// [privileges_u5] AS [privileges_u5],
// [schemaPath_u0] AS [schemaPath_u0],
[__KEY_root] AS [__KEY_root]
RESIDENT RestConnectorMasterTable
WHERE NOT IsNull([__KEY_root]);
LEFT JOIN
//[app]:
LOAD
[id_u1] AS [app.id],
[name_u0] AS [app.name],
// [appId] AS [appId],
// [publishTime] AS [publishTime],
// [published] AS [published],
// [stream] AS [stream],
// [savedInProductVersion] AS [savedInProductVersion],
// [migrationHash] AS [migrationHash],
// [availabilityStatus] AS [availabilityStatus],
// [privileges_u0] AS [privileges_u0],
[__FK_app] AS [__KEY_root]
RESIDENT RestConnectorMasterTable
WHERE NOT IsNull([__FK_app]);
[customProperties]:
LOAD
// [id_u0] AS [id_u0],
// [createdDate] AS [createdDate],
// [modifiedDate] AS [modifiedDate],
// [modifiedByUserName] AS [modifiedByUserName],
[value] AS [customProp.value],
// [schemaPath] AS [schemaPath],
[__KEY_customProperties] AS [__KEY_customProperties],
[__FK_customProperties] AS [__KEY_root]
RESIDENT RestConnectorMasterTable
WHERE NOT IsNull([__FK_customProperties]);
LEFT JOIN
//[definition]:
LOAD
// [id] AS [id],
[name] AS [customProp.name],
// [valueType] AS [valueType],
// [privileges] AS [privileges],
[__KEY_definition] AS [__KEY_definition],
[__FK_definition] AS [__KEY_customProperties]
RESIDENT RestConnectorMasterTable
WHERE NOT IsNull([__FK_definition]);
[tags]:
LOAD
// [id_u5] AS [id_u5],
[name_u1] AS [tag.name],
// [privileges_u4] AS [privileges_u4],
[__FK_tags] AS [__KEY_root]
RESIDENT RestConnectorMasterTable
WHERE NOT IsNull([__FK_tags]);
DROP TABLE RestConnectorMasterTable;
DROP FIELDS [__KEY_definition], [__KEY_customProperties];
-
Qlik Sense App: Send Data From The Load Script
QlikView has two features which allow it to send alerts and data to the user, using Alerts in the front end or QMC notifications on the Server. Presen... Show MoreQlikView has two features which allow it to send alerts and data to the user, using Alerts in the front end or QMC notifications on the Server. Presently Sense lacks these out of the box, but it is possible to implement the same using the free Qlik Web Connectors SMTP Connector.
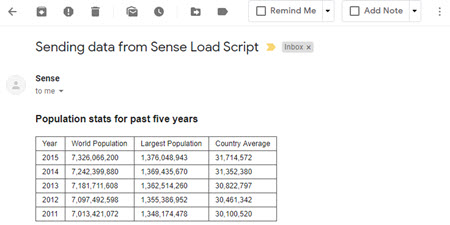
This application implements the sending of data as an HTML table embedded in an email each time an app is reloaded.
It was produced to go alongside this blog post, which describes the process in detail:
https://www.quickintelligence.co.uk/send-data-from-qlik-load-script/
I hope that you find the application useful. You will find other applications that I have uploaded under my profile on QlikCommunity or on our Downloads page..
Steve

-
Esri AcrGIS integration with Qlik GeoAnalytics
Esri AcrGIS Online integration with Qlik GeoAnalyticsIntroductionQlik GeoAnalytics gives us the power to perform spatial analysis within Qlik Sense an... Show MoreEsri AcrGIS Online integration with Qlik GeoAnalytics

Introduction
Qlik GeoAnalytics gives us the power to perform spatial analysis within Qlik Sense and QlikView apps. While many Qlik customers have existing GIS tools, their spatial assets are quite often sitting in silos. Combining spatial data with other data through Qlik's associative engine greatly enhances the business value that can be derived from such assets.
Some BI tools can make use of local files such as KML or Esri shape files as data sources, but this introduces security and maintenance headaches. With Qlik GeoAnalytics we have the capability to consume spatial content via hosted services. This document gives a step by step guide on how we can load data from secure content in ArcGIS to Qlik Sense.
The process described here is similar for for ArcGIS Online and on-premise, but I have only tried it out with ArcGIS Online.
The integration can be broken down into these steps:
- Implement App Login in ArcGIS
- Setup Qlik to get a security token
- Build a query for the secure content
- Load the data using Qlik GeoAnalytics
If the content is public, the process is simpler and you can skip the first two steps and ignore all the talk about tokens.
To try out these steps you will need an ArcGIS Online developer account which you can get here.
Implement App Login in ArcGIS
ArcGIS provides a way for applications to use secure content by using App Login. Once you register for a developer account, you'll see the option to create a new Application. Do that and you will be able to get the stuff we need to generate tokens in Qlik.
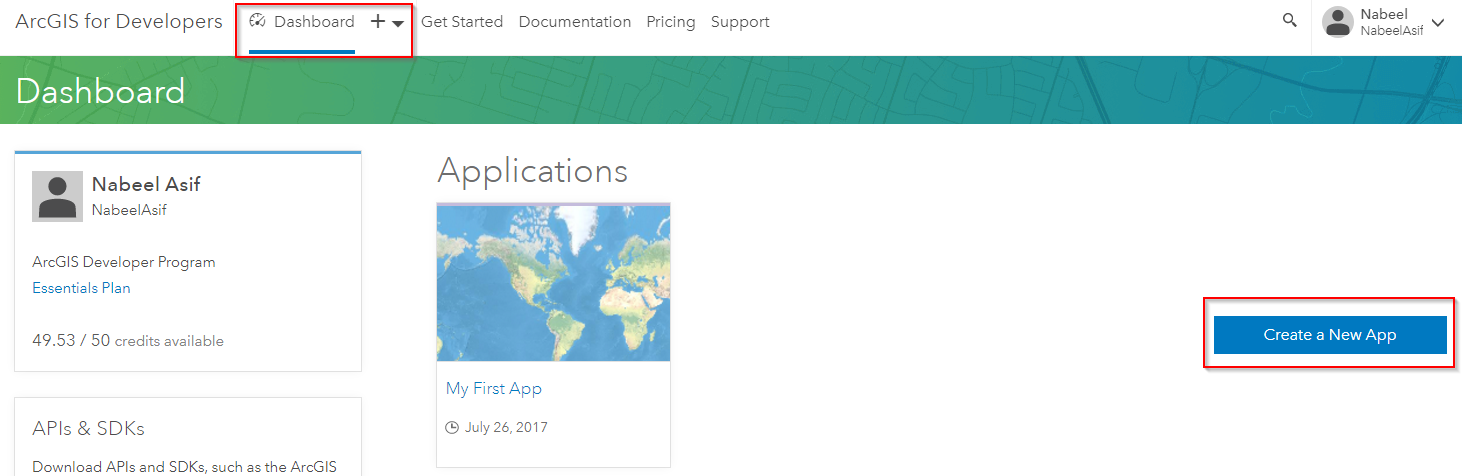

You'll need the Client ID and Client Secret to automate the process of getting new tokens in Qlik.
Setup Qlik to get a security token
We can use the Qlik REST connector to obtain a token in the load script. There is a good explanation of the process on the ArcGIS side here.
For ArcGIS online we need to make a request to: https://www.arcgis.com/sharing/rest/oauth2/token/
For an on-premise server the url will look like this: https://<host>:<port>/<subdirectory>/sharing/rest/oauth2/token
Create a new REST connection in Qlik Sense with the following parameters and the Client ID and Client Secret you obtained earlier.
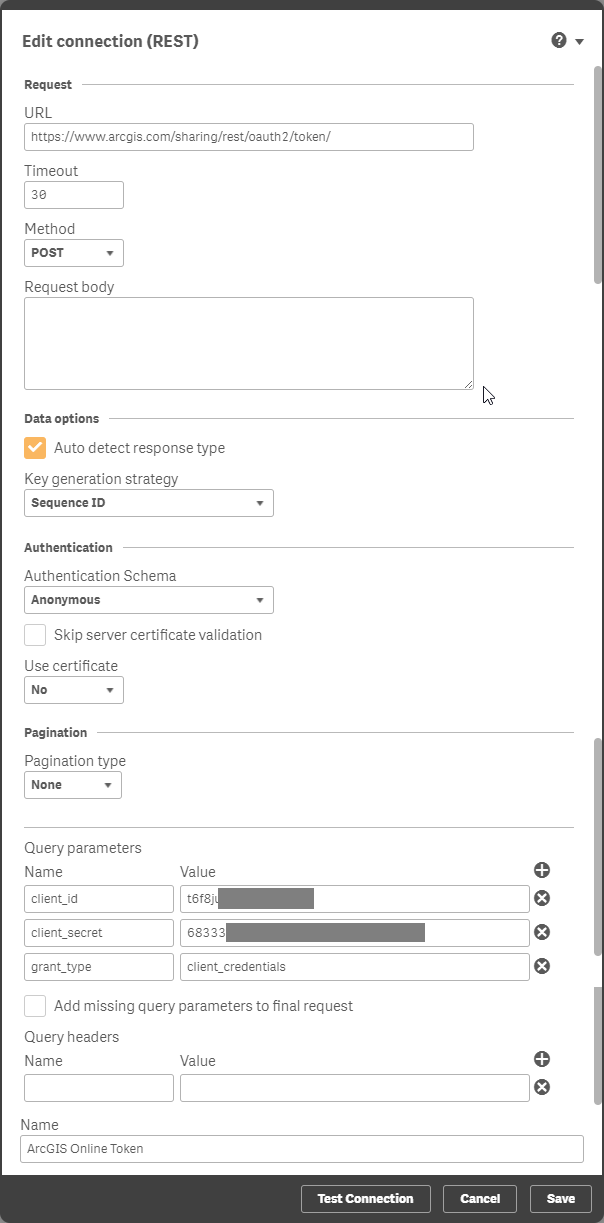
This will generate a load script to obtain the 'access_token'. Store the token into a variable in the load script. This can be done with the code below.
// Store the token in a variable that can be used as a request parameterLET vToken = Peek('access_token', 0, 'root');Tokens expire after a given period, but with this setup we can get the load script to obtain a new token before loading data from ArcGIS.
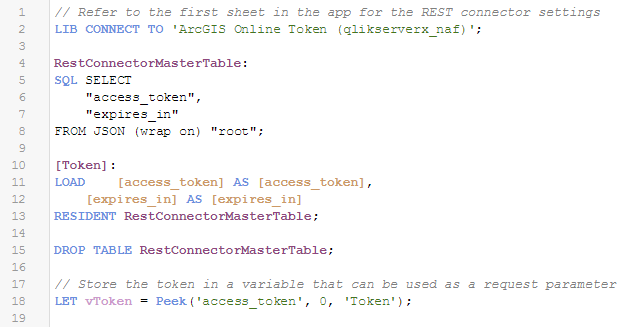
Run the load to confirm that you're able to obtain a token. Copy the token text as we'll need that to build a query. One way of doing this is to export it from a table object in Qlik Sense.
Build a query for the secure content
You'll need some private content on ArcGIS Online to test out this bit. Create a new layer by uploading some spatial content such as a zipped shape file.
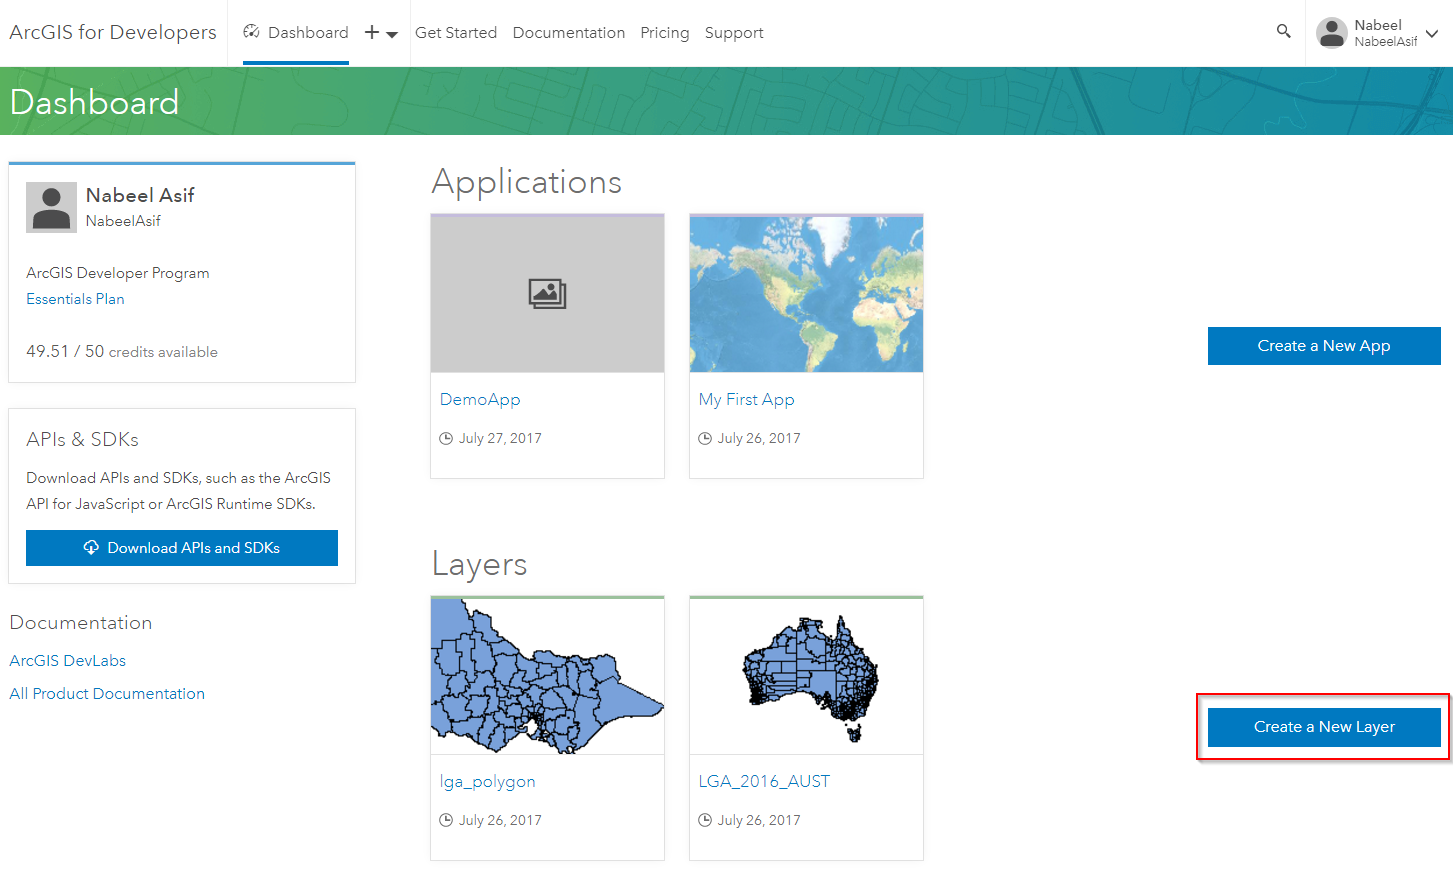
Make sure the security is set as private.
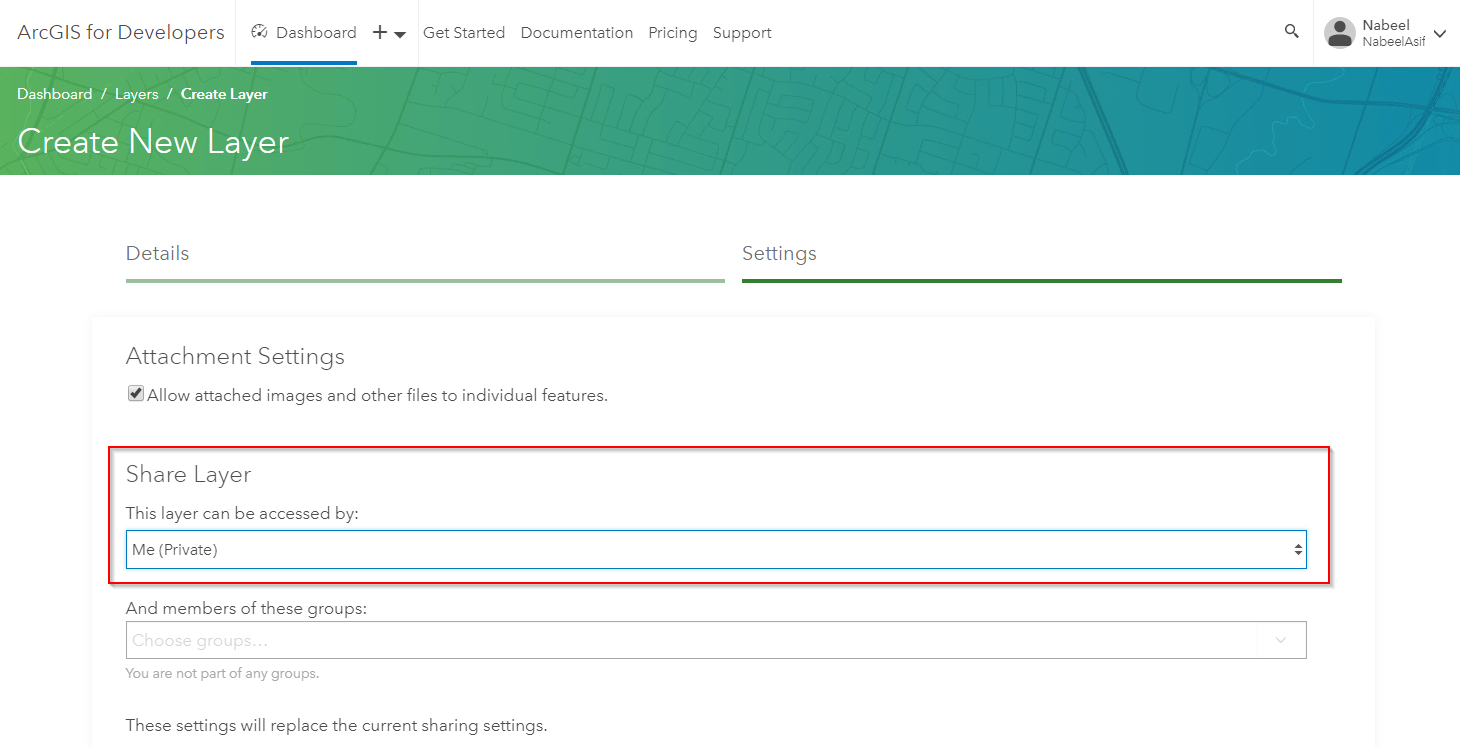
Once the layer is created you will be able to get a Service URL.
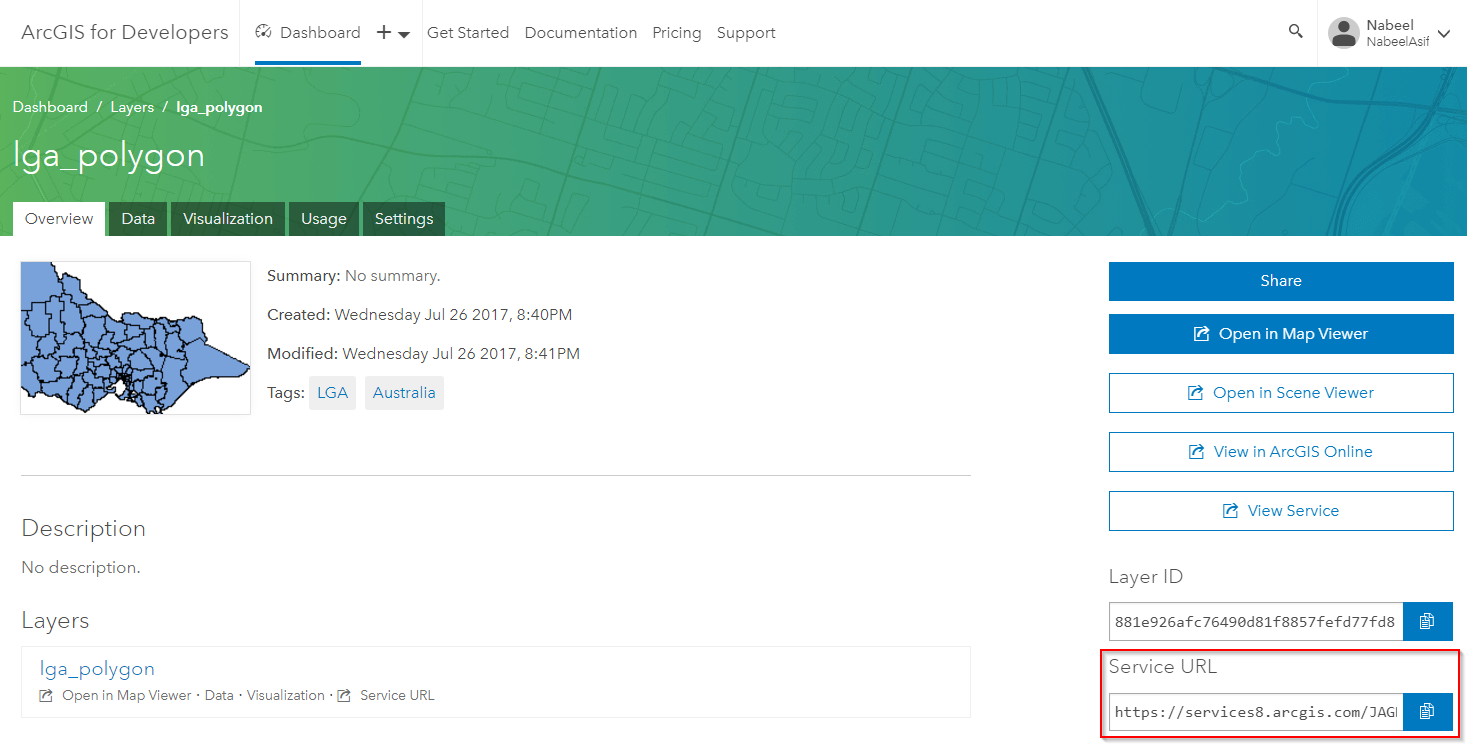
You can validate that the layer is private by trying out this URL in your browser. You should see a 'Token Required' message.
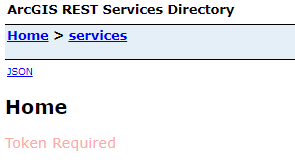
You can add the token we obtained earlier to the URL manually using the syntax: <Service URL>?token=<token>
This lets you get to the Service Directory. From here click on the layer name, scroll all the way to the bottom and click on Query.
You now need to build a query for this layer. I've highlighted the most common parameters you might need to set for the query. Once you're done click on the Query (GET) button.
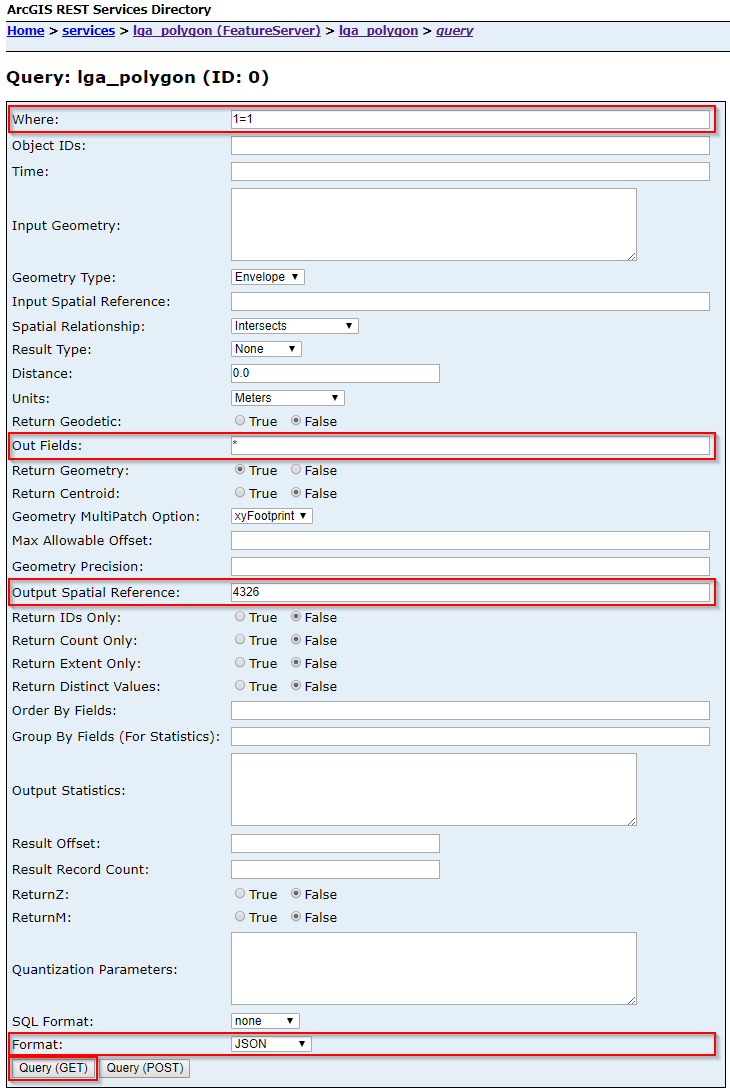
If everything goes well you should see the JSON output of the query in your browser. Copy the URL from your browser's address bar as we will use this for loading the layer in Qlik GeoAnalytics.
Load the data using Qlik GeoAnalytics
We can now use the URL we obtained for the query to load the layer into Qlik Sense. If you are loading a polygon layer I would recommend using the Simplify operation in the GeoAnalytics connector and excluding the original geometry field in the load. If you are loading a point layer you can use the Load operation.
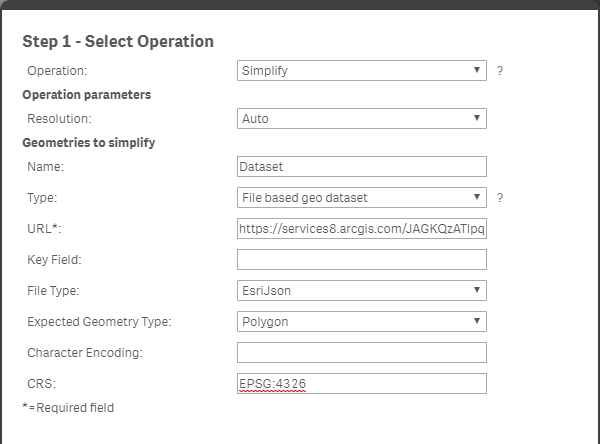

Once GeoAnalytics has generated the script you can change the hard coded token with the variable using dollar sign expansion i.e. $(vToken).

You should now be able to load the secure ArcGIS content into your Qlik Sense app.
-
Qlik Sense Examples Qlik GeoAnalytics
Qlik Sense Examples Qlik GeoAnalyticsEdit, apps have been updated to use the map chart for most examples.Store Site Selection demoThis app shows the c... Show MoreQlik Sense Examples Qlik GeoAnalytics
Edit, apps have been updated to use the map chart for most examples.
Store Site Selection demo
This app shows the customer distribution for a chain of stores. Contains customer behavior analysis, drive time calculations and what if analysis of new stores.
Tesla Supercharger Coverage
Coverage of Tesla supercharger stations in the worls. Calculations on actual road network and estimation of average battery range. Source: supercharge.info
Routing Danish Cities
An example showing routes between different cities. Show cases GeoAnalytics routing capabilities.
London Fire Brigade
London Fire Brigade incident and response time analysis.
Barcelona Traffic
Traffic analysis in Barcelona
Sales Location Analysis
Investigates locations of sales offices based on population living within 30 min drive time and overlap of uptake areas between sales offices. Uses GeoAnalytics TravelArea and Intersects operations.
Select Visible example
Shows how browsing large point data sets is made possible with the Select Visible feature.
Symbols in Bubble Layer
This app demonstrates an example of how Symbols can be used in the bubble layer. Most normal image formats can be used as symbols.
Chart Layer example
An example of how the Chart Layer can be used to plot data points on graphs (both bars and pies) using two dimensions. This example shows how the average house prices in Sweden have developed over time.
Line Layer example – Storms
Example of Line Layer using Storm data to visualize historical storms.
Heatmap example
Uses: Heatmap Layer, drill down with layers active in different levels, Bubble Layer with visibility restricted to resolution limits.
Drill down example
A drill down example with three different ways of using drill down data to visualize data. Sheet 1: Drill down based on State - County - Zip Sheet 2: Drill down based on Zip
US flight delay example
Uses: Bubble Layer with location ID for airport codes, Line Layer with location ID, line width and line color by measure, line arrows, Area Layer with location ID, select in map layer.
EU statistics example
Uses: Bubble Layer with latitude and longitude measures, bubble size and color by measure, Area Layer with location ID for country codes, area color by measure, transparency. -
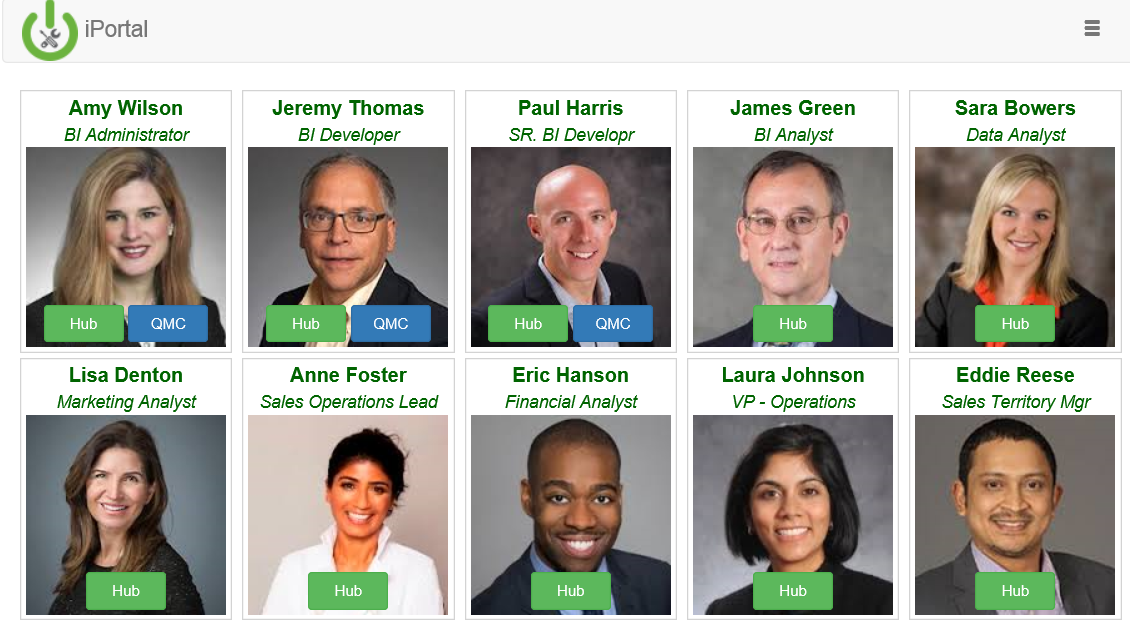
iPortal
iPortal is a web application that allows you to easily impersonate users in a Qlik Sense Enterprise deployment. It is not intended for production envi... Show MoreiPortal is a web application that allows you to easily impersonate users in a Qlik Sense Enterprise deployment. It is not intended for production environments. iPortal enables you to configure the list of users, groups, and images and login to Qlik Sense using these users. This enables you to demonstrate and test Qlik Sense from the viewpoint of many roles.
Additional security configuration is required to fully enable the Governed Self Service reference deployment. Please refer to the GSS Setup Guide for more information.
Video Overview
Download and Install
The fully automated installer will:
- Install the iPortal web application
- Configure the Qlik Sense service dispatcher to automatically run the iPortal web application
- Add & configure a Qlik Sense virtual proxy
- Add & configure a Qlik Sense user directory connector
For documentation on setting up a local iPortal development environment, click here
-
Enhancing: The GINQO Master Item Manager
Trouble maintaining your Master Items in Qlik Sense? Look no further, GINQO's Master Item Manager has been further improved. Master Items can be diffi... Show MoreTrouble maintaining your Master Items in Qlik Sense? Look no further, GINQO's Master Item Manager has been further improved. Master Items can be difficult to maintain as you create more of them, which is risky for your development. To solve this issue we have enhanced the GINQO Master Item Manager to help you work even more effectively with Master Items.
An improved UI as well as better error handling and Drill-down support makes this a great option for your development. Additionally all Dimensions/Measures are now tagged by the Extension, making it even easier to maintain and manage them.
Try our Master Item Manager extension (https://github.com/GINQO/Master-Item-Manager). Comments and Feedback are always welcome. Additionally, let us know if you would like to contribute to the open-source community.
What is it?
- The GINQO Master Item Manager (MIM) is a simple utility tool meant for synchronizing your Master Items from an Excel file. That Excel file can then be used to define the Master Items across multiple applications.
- The MIM can also be useful for exporting Master Items into an Excel file for review/validation.
- After adding Master Items to a template file, you are able to reuse them among other Sense apps
- From a table object, you can decide which Master Items you want to be added to your Qlik Sense applications.
- Using Qlik's associative engine, Master Items can be organized into your application by means of tags, name, descriptions, etc.
Why was it built?
- The Qlik Governed Metrics Service (https://developer.qlik.com/garden/57655702febb2ca54e7149d2
- has not been further developed and is not working for the latest Qlik Sense releases
- It requires installation of additional software and might not meet the security requirements in your environment
- Master Items are slow to create but are frequently reused
- Some customers use the same data sources, meaning same metrics
- Customers have requested this feature to manage Master Items themselves
- Occasionally you might create duplicate Master Items and be unaware of it.
Who is it for?
- Developers who are reusing Master Items across multiple applications
- Customers who want more control over their QS environment
-
Introducing: The GINQO Master Item Manager
Managing Master items can be time consuming. Master Items can also become difficult to maintain and validate as more are created, risking consistency... Show More -
Showing support message on top of the Qlik Sense HUB (forcing update client-side...
Communication is a key point for any project and failing to do it may compromise your success.Having this in mind, I dedicated some time to find out a... Show MoreCommunication is a key point for any project and failing to do it may compromise your success.
Having this in mind, I dedicated some time to find out a way to display a message on the Qlik Sense HUB and make sure that all users would be able to see that.
Thanks to @j_twardziak and his post Showing support message on top of the Qlik Sense Hub page, my target was accomplished.
However, when I implemented my version, I realized that the header message was not being displayed on the HUB unless CTRL + F5 was pressed (a normal behavior for web). Then, how do you communicate with your users if they didn't receive the message?
In the document attached, I shared step by step how to implement a header message (my version) on the Qlik Sense HUB and what needs to be changed in order to force the client-side to be updated. Before doing any changes, ALWAYS make a backup of the files.
Here is how it looks like.
Although I didn't have implemented @berndjaegle 's suggestion, he explains how to add an URL to the header message in the original post.
Qlik Sense environment
- Qlik Sense Enterprise June 2019 Patch 1.
- Multi-node environment.
- Qlik Sense Repository Database is located in the central node server.
IMPORTANT: Keep in mind that the changes shared here are not supported by Qlik.
Best regards,Huberto Pereira Haidemann
-
Best Practices of Qlik Sense Multi-Node Setup, Load Balancing & Maintenance(Let'...
Hello Everyone, First of all, thanks for reading! I found it is amazing to connect myself to people around the world and communicate with my writings... Show More -
Qlik Sense + DeepSeek and The Iron Throne
DeepSeek represents a milestone in the evolution of LLM tools. It exemplifies how innovative approaches can increase the accuracy and applicabilit... Show More -
Creating Mini Chart in Qlik Sense tables
Hi all,Mini Charts have always been a good feature in QlikView and It's really 'frustrating' that this has not been added (yet) in Qlik Sense.With hop... Show MoreHi all,
Mini Charts have always been a good feature in QlikView and It's really 'frustrating' that this has not been added (yet) in Qlik Sense.
With hopes that the Qlik Team will think about such improvements for the next releases, let's discuss here how to create our own mini chart in a Qlik Sense Table.
The following expressions might seem 'complicated' at first sight, but remember that It will be generic.
You'll only have to change your : Dimension(s) and Measure to adapt to your need.
Thus, their use will be very easy.
Let's begin :
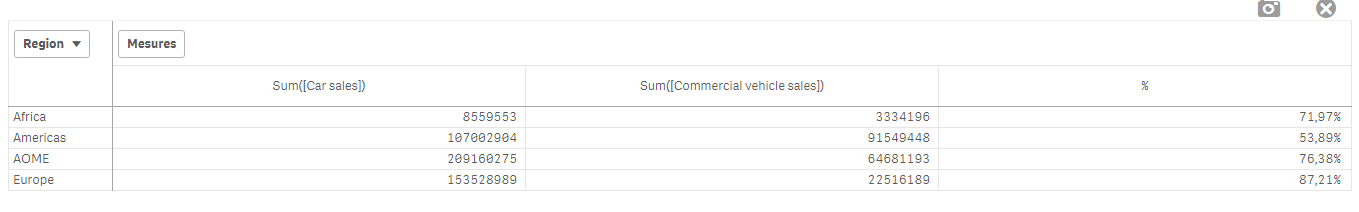
Suppose we have:
As a dimension: OICA Region
As measures:
Sum(Sales)
Sum("Commercial Vehicle Sales")
Sum(Sales) / (Sum(Sales)+Sum("Commercial Vehicle Sales"))
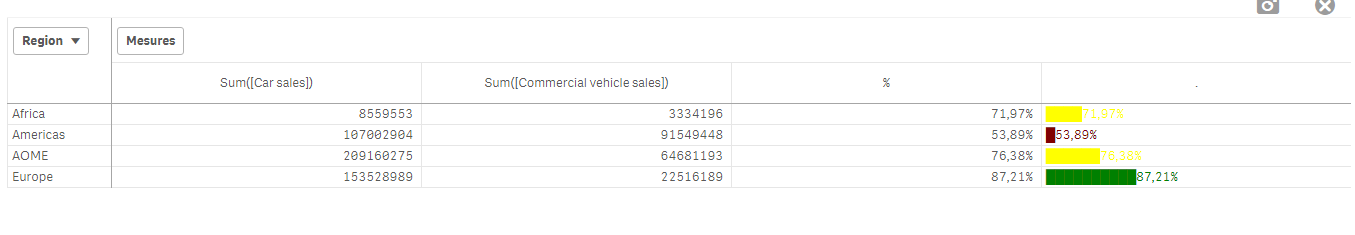
Here is our current table:
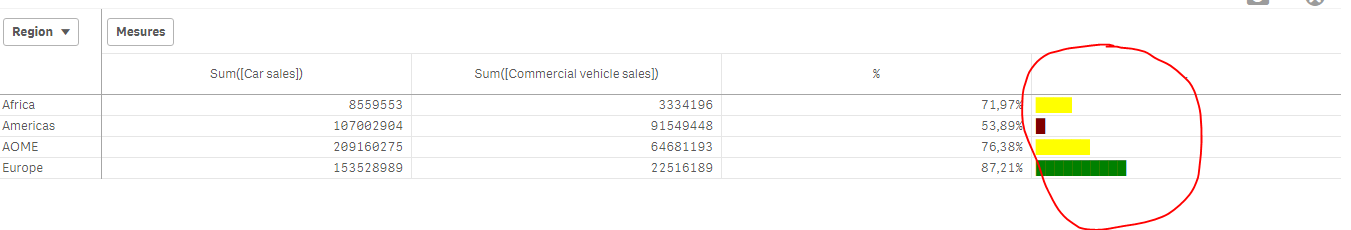
Now, we want to add, a mini 'bar' to represent the %:
How to do so:
As an expression:
=repeat('█',
rangemax(rangemin( ceil(((column(1)/column(2))-1)*2.5),10),0)
)
With that, we repeat the square sign and precise the limits.
And as a text Color expression:
if( (sum([Car sales])/(sum([Car sales])+sum([Commercial vehicle sales])))>=0.8,Green(),
if((sum([Car sales])/(sum([Car sales])+sum([Commercial vehicle sales])))>=0.7,Yellow(),
Red()))
Result:
We can also Add the % in front of the bar by adding it in the expression:
From :
=repeat('█',
rangemax(rangemin( ceil(((column(1)/column(2))-1)*2.5),10),0)
)
To:
=repeat('█',
rangemax(rangemin( ceil(((column(1)/column(2))-1)*2.5),10),0)
) & num((sum([Car sales])/(sum([Car sales])+sum([Commercial vehicle sales]))),'# ##0,00%')
Result:
You can even alter it as follow:
repeat(chr(09608),round( sum([Car sales])/(sum([Car sales])+sum([Commercial vehicle sales])) * 10))
&repeat(chr(09617),10-round( sum([Car sales])/(sum([Car sales])+sum([Commercial vehicle sales])) *10))
&num((sum([Car sales])/(sum([Car sales])+sum([Commercial vehicle sales]))),'# ##0,00%')
&if(sum([Car sales])/(sum([Car sales])+sum([Commercial vehicle sales]))>0.7,'▲','▼')
result:
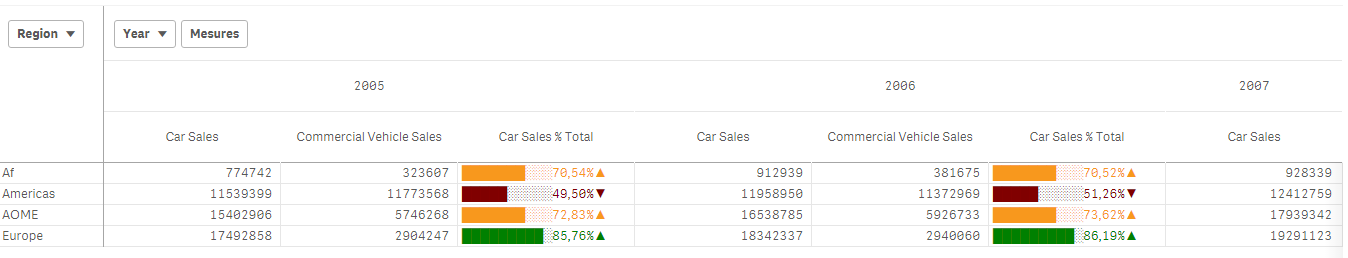
Now, let's suppose we want to add another mini chart, a trend one, to see the % expression by Year:If it has increased or decreased from a year to the next one.
How to do so?
Expression:
=concat(
aggr(
if((sum([Car sales])/(sum([Car sales])+sum([Commercial vehicle sales]))) > above((sum([Car sales])/(sum([Car sales])+sum([Commercial vehicle sales])))),
'▀',if((sum([Car sales])/(sum([Car sales])+sum([Commercial vehicle sales]))) < above((sum([Car sales])/(sum([Car sales])+sum([Commercial vehicle sales])))),'▄',' ')
)
,[OICA region], (Year,(NUMERIC, ASCENDING))
)
,'',[OICA region])
Wirh:
Red: Our Dimension
Green: The trending dimension
Blue: our expression compared to the previous one (by year, the trending expression)
If expression by Year > expression Previous Year then , Square Up
If expression by Year < expression Previous Year then , Square down
Result:
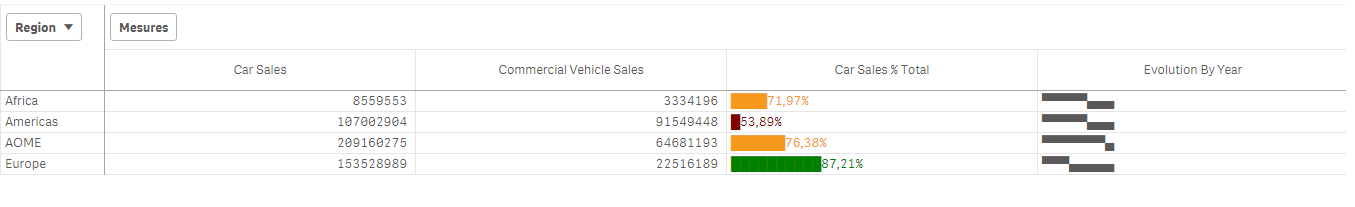
Special thanks to blog Von Heldendaten in which I found this:
QlikView + Qlik Sense Blog von Heldendaten: Qlik Sense Calendar Measures & "Minicharts" in Tabellen.
Hope you like it !
Omar,
-
Qlik & Python – Made for Each Other
Qlik Embedded Analytics offers a powerful solution to embed analytics capabilities directly into custom systems and applications, providing a more... Show More -
Exporting lists from QMC to Excel
I stumbled upon this feature while trying desperately to simply get a list of items displayed in the QMC exported into an Excel spreadsheet. If there ... Show MoreI stumbled upon this feature while trying desperately to simply get a list of items displayed in the QMC exported into an Excel spreadsheet. If there are other simpler methods, please let me know.
The tip requires OneNote and Excel and Internet Explorer (Other browsers not tested)
If you have any questions let me know.
Shaun

-
Store a QlikSense table directly into an SQL table using the script.
Hi community,I assume we all, once in a while, faced this question : "Is it possible to store a table from QlikSense into our database?"Since QlikSens... Show MoreHi community,
I assume we all, once in a while, faced this question : "Is it possible to store a table from QlikSense into our database?"
Since QlikSense is not made to write into a database but rather select from it, the idea is to create a procedure/function within the sql database, that will populate the table when called from the Qlik Sense script.
So, without further due, the answer is : YES !
I'll now share with you how I did to implement this:
1) The database should allow the creation of Procedures/functions.
For this example, I will be using postgresql.
a) create the table :
The first step is to create the table within the sql database :
example:
CREATE TABLE alerts
(
alertname character varying(100) ,
desk character varying(100)
)
b) create the Function:
The function writeback will be responsible of populating the table alerts:
CREATE OR REPLACE FUNCTION writeback(
alertname character varying,
desk character varying)
BEGIN
INSERT INTO alerts VALUES (alertname,desk);
END;
c) Connect to the postgresql database and call the function:
Now, in the Qlik Sense script; what we want to do is store the table QlikSenseAlerts into the table alerts created within the Postgres db
QlikSenseAlerts:
// 1) the idea is to add rowNo() field to go through all the lines of our QlikSenseAlerts table
alerts:
load *,RowNo() as row inline [
Alert , Desk
alert1, desk1
alert2 ,desk1
alert3 , desk2
alert4, desk4
alert5, desk5
alert6, desk6
alert7, desk7
alert8, desk8
alert9, desk9
alert10, desk10
alert11, desk11
alert12, desk12
alert13, desk13
alert14, desk14
alert15, desk15
alert16, desk16
alert17, desk17
alert18, desk18
alert19,desk19
alert20,desk20
];
//2) connect to our database
LIB CONNECT TO 'PostgreSQL_localhost';
//3) line by line, store the value of each column in a variable
for a=0 to FieldValueCount('row')-1
Let vAlert = Peek('Alert',$(a), 'alerts');
Let vDesk = Peek('Desk',$(a),'alerts');
//4) call the function writeback that will store our 2 variables into the sql table; each variable contain the columns'value of the 1st row
SELECT public.writeback('$(vAlert)','$(vDesk)');
//5) do the same thing for all the lines
next a;
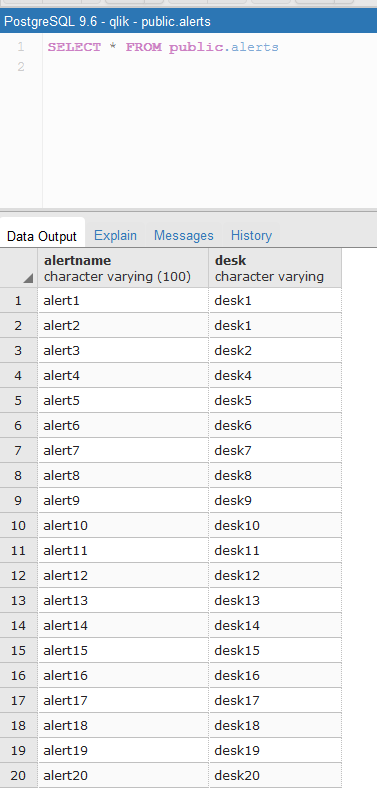
Result:
Table alerts in the sql table before reloading qlik sense script:
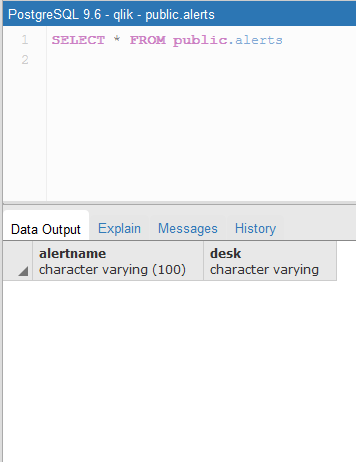
We, run the script:
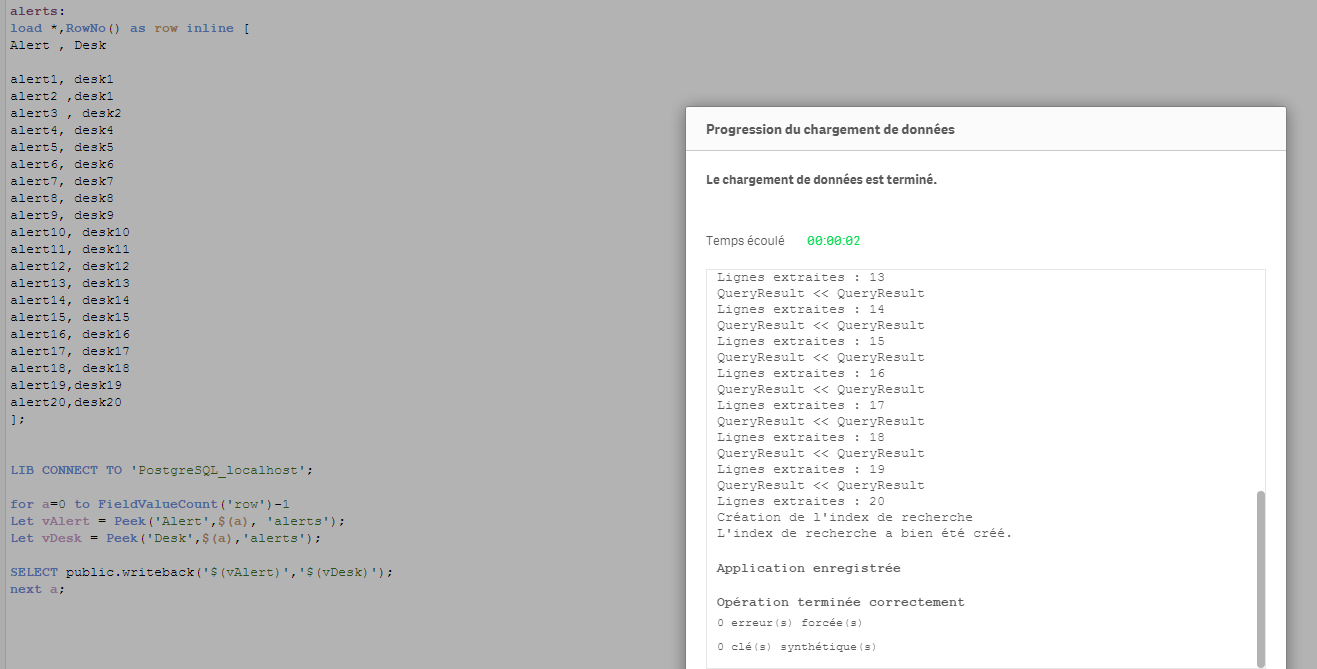
Table alerts in the sql table after reloading qlik sense script:
Hope you'll like it

Omar BEN SALEM.
-
Using Set analysis Excel variables in Qlik Sense
Using Excel variables in Qlik Sense Approach : Use excel sheet for loading all set analysis in Qlik Sense environment and use those variables as a ex... Show MoreUsing Excel variables in Qlik Sense
Approach : Use excel sheet for loading all set analysis in Qlik Sense environment and use those variables as a expression in Qlik Sense Charts.
Environment
- Qlik Sense
Resolution
Simple approach to load all set analysis expressions using excel sheet and maintain at one place and use the same for expressions in Qlik Sense Charts.
Find attached excel sheet containing YTD, Current YTD, Growth % formulas in excel sheet same has been loaded in QS & used in Chart as a variable.
-
Qlik Engine Health-Check Analysis (app included)
Monitoring current performance and availability of Qlik Sense site is not out-of-the-box feature, but can be easily achieved with native REST connecto... Show MoreMonitoring current performance and availability of Qlik Sense site is not out-of-the-box feature, but can be easily achieved with native REST connector and requesting engine\healthcheck JSON API.
There are other tools and approaches, but since I already have the best BI tool available 😉, I found it reasonable to use it. All that is necessary is just:
- download and import the attached app
- create REST Data Connections and adjust the settings in the script
- schedule app reload
This Qlik Sense app:
- loads engine\healthcheck JSON data from multiple nodes
- parses and consolidates it to two tables
- stores them to QVDs with all previous snapshots
- visualizes key metrics of engine utilization and availability in time
It's recommended to deploy and schedule this app on DEV or TEST site, pointing to all production nodes. Otherwise, there will be no data loaded in case the production engine (or the whole server) crashes.
(just FYI - DEV and TEST sites are included in the professional license subscription)It's also recommended to read the official help site info about the engine API before you deploy this app.
After importing the app to a suitable site, follow these steps:
1. Decide on target folder for result QVD files, where parsed snapshot of JSON data will be stored. Create a folder Data Connection (if it doesn’t already exist) and set its Lib name to vQVDpath variable in Settings script section.
2. Create a REST Data Connection to each node:
URL: https://<server domain>/engine/healthcheck OR https://<node IP address>:4747/engine/healthcheck
Authentication Schema: Windows NTLM
User name & password: type root admin or service user credentials
check "Skip server certificate validation" if there is no valid certificate on target nodeQuery headers:
User-Agent: Windows
Cache-Control: no-cache3. Adjust the INLINE table in the Settings section of the script according to your site
node - name of the node that will be shown for app’s user
restConnection - name of the REST connection that points to node’s engine/healthcheck
RAM - amount of node's memory in GB
CPU - number of node's logical processors4. Schedule a reload task. The recommended app reload frequency is 5 minutes or less (tested reload duration on the 4-node site is 12 seconds). The script will return "N/A" in [isSaturated] field when the engine is not responding.
The current roadmap includes - script for email notifications, possibility to load only N days back, mapping app name to IDs, node comparisons.
PLEASE! If you make adjustments or additions to the script or front-end visualizations, please share them back on the Qlik Community.
Happy Qliking 🙂
-RADO-


