Unlock a world of possibilities! Login now and discover the exclusive benefits awaiting you.
- Qlik Community
- :
- All Forums
- :
- QlikView Administration
- :
- Google maps not public website
- Subscribe to RSS Feed
- Mark Topic as New
- Mark Topic as Read
- Float this Topic for Current User
- Bookmark
- Subscribe
- Mute
- Printer Friendly Page
- Mark as New
- Bookmark
- Subscribe
- Mute
- Subscribe to RSS Feed
- Permalink
- Report Inappropriate Content
Google maps not public website
Does anyone know if and how much you have to pay if you want to use google maps in a qlikview application that is only available after logging in.
- Mark as New
- Bookmark
- Subscribe
- Mute
- Subscribe to RSS Feed
- Permalink
- Report Inappropriate Content
http://www.google.com/enterprise/earthmaps/maps_features.html and then press "Contact Sales" button. I think they hve some minimum price upto a certain number of calls and then it goes up.
- Mark as New
- Bookmark
- Subscribe
- Mute
- Subscribe to RSS Feed
- Permalink
- Report Inappropriate Content
Thanks, I was hoping for someone had experience with the costs and maybe some workarounds / other solutions for maps in QlikView.
The ones I know all need a plug in and my customer doesn't want local installation
- Mark as New
- Bookmark
- Subscribe
- Mute
- Subscribe to RSS Feed
- Permalink
- Report Inappropriate Content
From Google page http://www.google.com/enterprise/earthmaps/maps_features.html
What is the cost of Google Maps API Premier?
- Mark as New
- Bookmark
- Subscribe
- Mute
- Subscribe to RSS Feed
- Permalink
- Report Inappropriate Content
Hello,
we offer a service called GlobeQlik, where you can render maps on different levels of detail. We use Open Street Map as mapping service and you can generate colored heatmaps, bubble charts on a map, regular pie charts on the map and much more.
Our pricing is based on the amount off different maps and their level of details. Even custom designed overlay shapes are possible. (and in most cases it's a lot cheaper than the above named pricing model ;-))
For more information please visit our website http://www.globeqlik.com or send me an email to gerald.stockinger@hpartner.at. In the download section of our homepage you can also find free samples.
Please don't hesitate to contact me.
Greets,
Gerald
- Mark as New
- Bookmark
- Subscribe
- Mute
- Subscribe to RSS Feed
- Permalink
- Report Inappropriate Content
Hi,
If you want you could try out Idevio Maps as an alternative, it's a faster, more interactive way to use maps within Qlikview. Main benefits are:
- Fast map with dynamic zoom and pan.
- Client side rendering, handles thousands of objects with ease.
- Plug and play, easy to setup and configure.
- Extendable, the extension serves as a starting point.
- World coverage, street level for many areas.
- Secure, own hosting possible.
Idevio Maps are available to Qlikview 10 as an extension object.
Visit www.idevio.com/demo for more info and demo (logon on with demo demo).
- Mark as New
- Bookmark
- Subscribe
- Mute
- Subscribe to RSS Feed
- Permalink
- Report Inappropriate Content
Hi All,
GIS/Maps Analytics is a very interesting topic indeed.
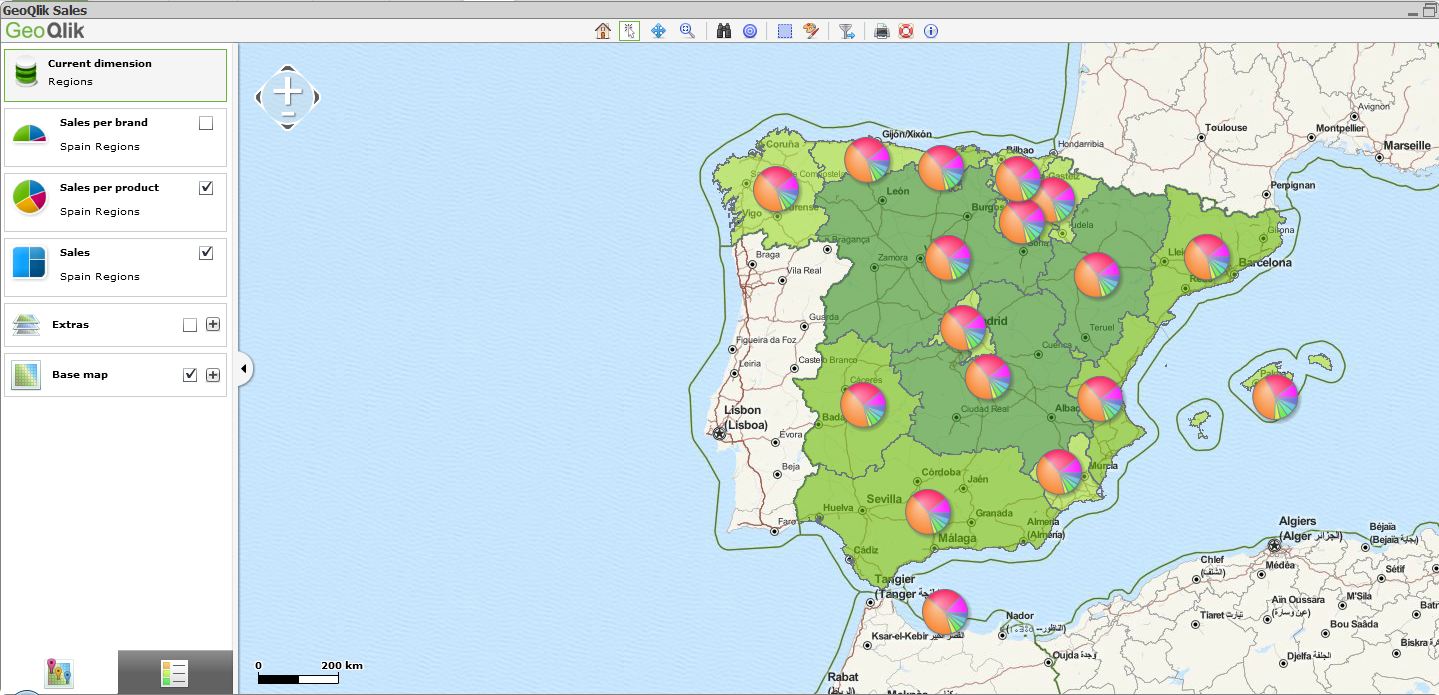
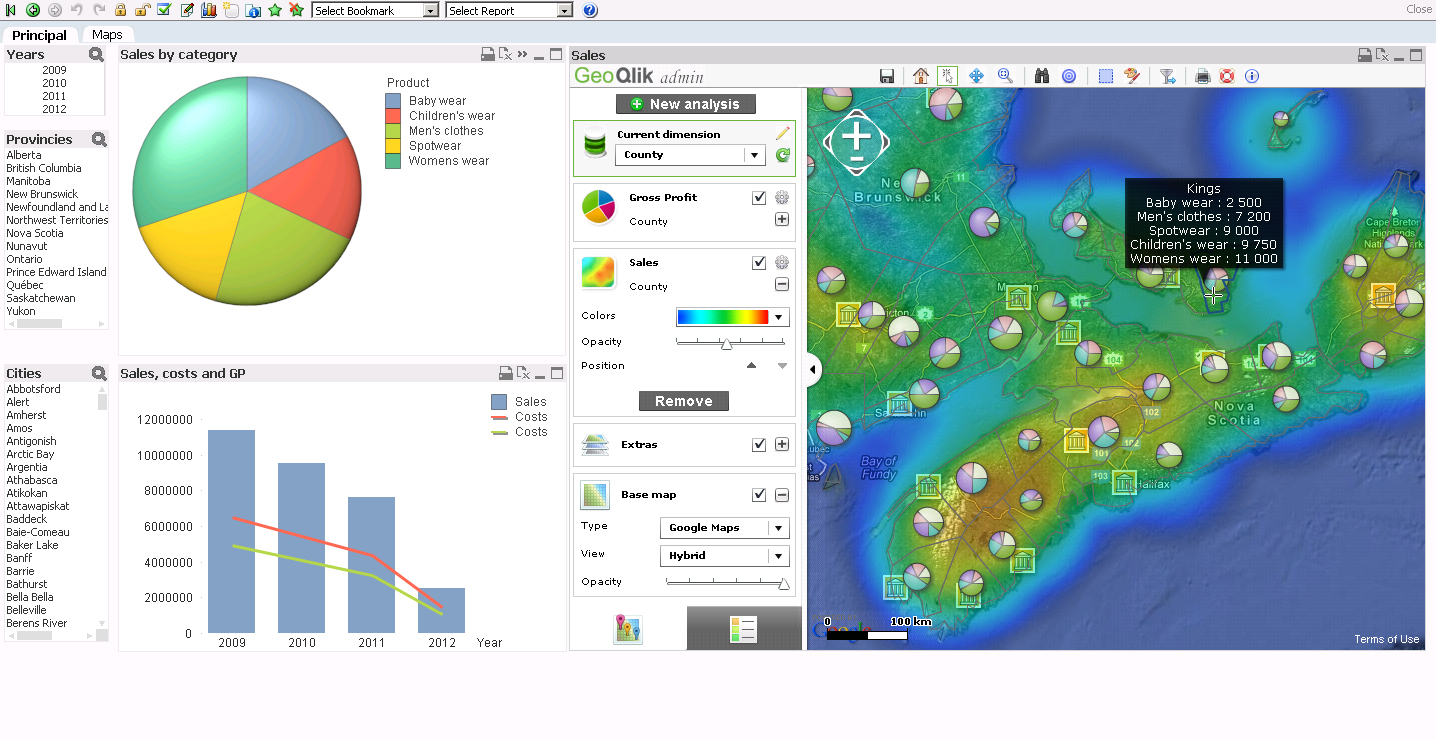
However, there are many technical limitations in using Google Maps (GMaps) to display QlikView KPI indicators. Indeed, the drill-down, pan and selection capabilities are quite limited. Moreover, you cannot display several indicators at the same time and on the same map (background + foreground indicators), you are also limited to draw bubbles and therefore you cannot display pie/bar charts nor "real" heat maps. Finally, you cannot display QlikView KPIs on specific Sales/Business Areas with GMaps such as the Bricks in the Pharmaceutical sector (Brick = aggregation of zipcodes).
On top of that, there are also a few "commercial" aspects to be considered since many QlikView customers & channel partners use GMaps API "FREE" Key inside their QlikView server or rich client without complying with GMaps license terms...Indeed, for "professional internal use" (intranet, extranet or internet with username/password authentication to QlikView application), you must buy GMaps API "Premier" which costs about 10,000 $ USD per year or 8,500 euros per year + possible extra fees depending upon the total number of daily hits.
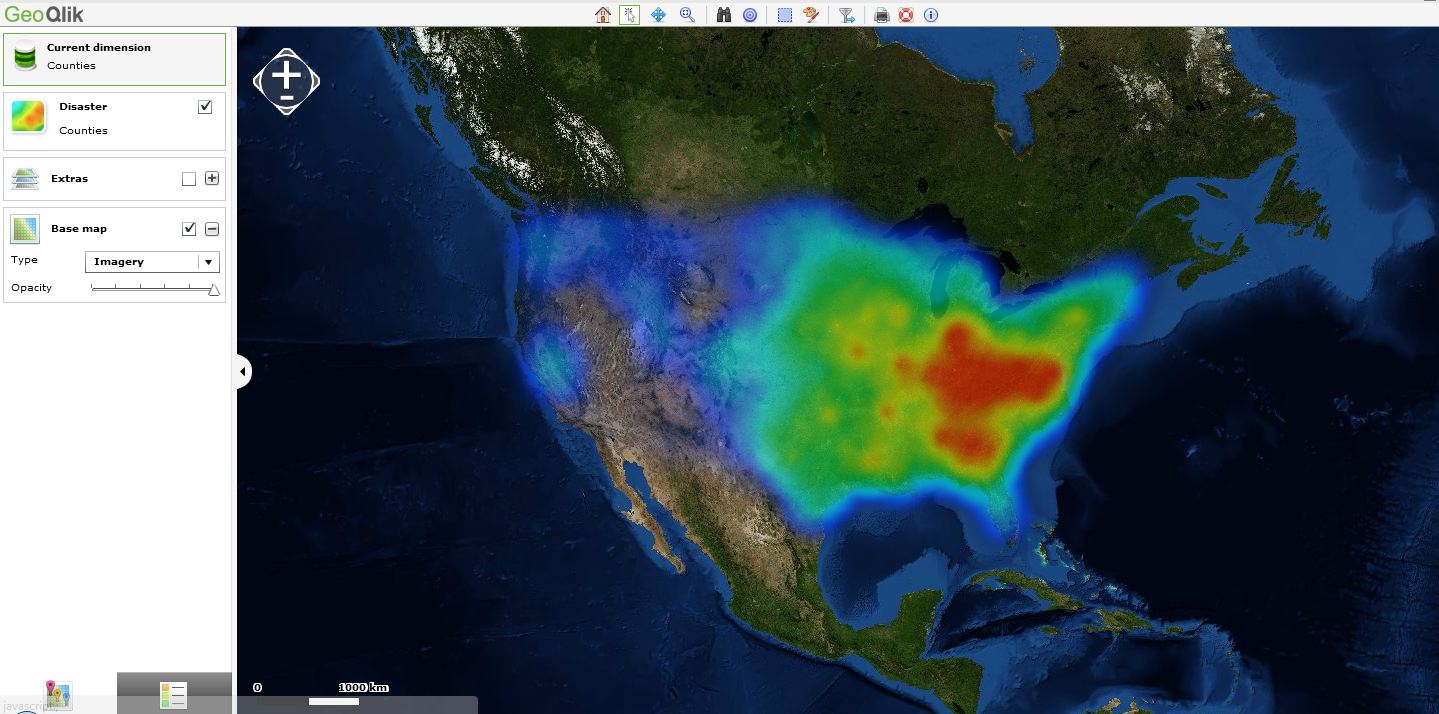
A few alternatives exist such as Open Street Map (totally FREE) or other WMS/TMS services. I hereby suggest you to have a look at our new mapping extension for QlikView 11 SR1 namely "GeoQlik v11.6":
http://www.geoqlik.com/en/geoqlik-for-qlikview/geoqlik-v11.html
Please find hereafter a few screenshots of GeoQlik V11.6 using WMS/TMS services to display QlikView KPIs:

Thanks and best regards,
David
@ Business Geografic