Unlock a world of possibilities! Login now and discover the exclusive benefits awaiting you.
- Qlik Community
- :
- All Forums
- :
- QlikView Administration
- :
- Governance Dashboard 2.0.2 (SR2) released today!
- Subscribe to RSS Feed
- Mark Topic as New
- Mark Topic as Read
- Float this Topic for Current User
- Bookmark
- Subscribe
- Mute
- Printer Friendly Page
- Mark as New
- Bookmark
- Subscribe
- Mute
- Subscribe to RSS Feed
- Permalink
- Report Inappropriate Content
Governance Dashboard 2.0.2 (SR2) released today!
Hi all - SR2 of Governance Dashboard (2.0.2) has been released to address several bugfixes. Please consider updating to this version (just by configuring the Configuration page of the new app just as you have with prior versions. Enjoy!
- « Previous Replies
-
- 1
- 2
- Next Replies »
- Mark as New
- Bookmark
- Subscribe
- Mute
- Subscribe to RSS Feed
- Permalink
- Report Inappropriate Content
Note that one bug (GOVDASH-131) has been identified with Governance Dashboard 2.0.2 in which the reload fails unless you have something in the "Files/Folders to exclude". 
There are two options for a workaround:
1) Add something in the Files/Folders to Exclude parameter (like zzzz)
or
2) Modify the load script by replacing the SUB filescan section (tab) with the following: (UPDATED Dec 7, 2016)
SUB fileScan
IF NoOfFilePaths > 0 then // Run this only if there are files & paths to scan
TRACE Generating list of files (qvw,qvd) to scan;
// Check if any exclusions are set
If len('$(vInputFilesFoldersExclusion)') = 0 then
TRACE No file or folder exclusions were set in the Configuration.;
set NumExclusions = 0;
ELSE
Let vInputFilesFoldersExclusion = trim(vInputFilesFoldersExclusion);
Let vFilesFoldersExclusionCleaned = if(right('$(vInputFilesFoldersExclusion)',1)='|',left('$(vInputFilesFoldersExclusion)',len('$(vInputFilesFoldersExclusion)')-1),'$(vInputFilesFoldersExclusion)');
Let vInputFilesFoldersExclusion = vFilesFoldersExclusionCleaned; // replace input for exclusions with the cleaned up version
LET NumExclusions = SubStringCount('$(vFilesFoldersExclusionCleaned)','|')+1;
TRACE $(NumExclusions) exclusion strings found in user input: $(vInputFilesFoldersExclusion).;
For i = 0 to $(NumExclusions)-1
LET exclusion$(i) = lower(trim(subfield('$(vFilesFoldersExclusionCleaned)' ,'|',$(i)+1)));
Next i
ENDIF
// Creating a table with all filepaths (folders + subfolders)
FilePaths:
Load %Path as %FilePath, RowNo() as %FilePathNumber
Resident inputPaths where %Area = 'File';
SUB fileSearch (root,n)
// Just looking for qvws, qvds for the file scan; QVX scan is not supported in GovDB 2.x
For Each Ext in 'qvw','qvd'
FOR EACH File in filelist ('$(root)' & '\*.'&Ext)
IF NumExclusions > 0 THEN
set exclusionsFound = 0;
For x = 0 to $(NumExclusions)-1
let exclusionsFound = exclusionsFound + SubStringCount(lower('$(File)'),'$(exclusion$(x))');
Next x
If exclusionsFound > 0 then
let msg = 'The file $(File) has been excluded from this scan due to user defined exclusion parameter.';
TRACE $(msg);
ExcludedFiles:
Load '$(File)' as ExcludedFile, $(exclusionsFound) as ExclusionRulesFound Autogenerate 1; // Generate a table of excluded files
ELSE
CALL fileList ('$(File)','File',Ext,$(n))
ENDIF
//next x
ELSE
CALL fileList ('$(File)','File',Ext,$(n))
ENDIF
NEXT File
NEXT Ext
for each fldr in DirList('$(root)'&'\*')
IF NumExclusions > 0 THEN
set exclusionsFound = 0;
For x = 0 to $(NumExclusions)-1
let exclusionsFound = exclusionsFound + SubStringCount(lower('$(fldr)'),'$(exclusion$(x))');
Next x
IF exclusionsFound > 0 then
let msg = 'The folder $(fldr) has been excluded from this scan due to user defined exclusion parameter.';
TRACE $(msg);
ExcludedFiles:
Load '$(fldr)' as ExcludedFile, $(exclusionsFound) as ExclusionRulesFound Autogenerate 1; // Generate a table of excluded files
ELSE
Concatenate (FilePaths)
Load '$(fldr)' as %FilePath, RowNo() as %FilePathNumber autogenerate(1);
CALL fileSearch ('$(fldr)',$(n))
ENDIF
ELSE
Concatenate (FilePaths)
Load '$(fldr)' as %FilePath, RowNo() as %FilePathNumber autogenerate(1);
CALL fileSearch ('$(fldr)',$(n))
ENDIF
next fldr
ENDSUB
// For each File folder to scan....
For j = 0 to $(NoOfFilePaths)-1
CALL fileSearch ('$(vFilePath$(j))',$(j))
Next j
drop table FilePaths;
CALL qvwMetadata
CALL qvdMetadata
CALL TableLineage
ELSE // No Paths to scan
TRACE No File paths to scan. Skipping.;
ENDIF
ENDSUB
- Mark as New
- Bookmark
- Subscribe
- Mute
- Subscribe to RSS Feed
- Permalink
- Report Inappropriate Content
It looks to me like the Max RAM usage on the Server Performance Summary sheet is actually showing average RAM usage rather than max. I believe this is a 2.0.2 bug.
- Mark as New
- Bookmark
- Subscribe
- Mute
- Subscribe to RSS Feed
- Permalink
- Report Inappropriate Content
Yes, you are correct. It is calculating avg() RAM instead of Max Ram. (Who made that app anyway?!)
I have filed the bug w/ R&D, GOVDASH-146.
Thanks!
- Mark as New
- Bookmark
- Subscribe
- Mute
- Subscribe to RSS Feed
- Permalink
- Report Inappropriate Content
Just a quick addition that users/Qlik Server Admins might think is a useful visualisation. You can view all your tasks as a Gantt-Waterfall (start to finish time), especially (as in my case) to view the "free" times to allocate new tasks in these empty slots.
In order to do so, create a horizontal bar chart with:
Dim: TaskResult_Name
Expr: "MaxString(NUM(FinishedAt)) - MaxString(NUM(StartedAt))"
with offset "FRAC(MaxString(StartedAt))"
Sort by: Expr = "MaxString(StartedAt)".
- Mark as New
- Bookmark
- Subscribe
- Mute
- Subscribe to RSS Feed
- Permalink
- Report Inappropriate Content
cheenu.janakiram - Thanks for the tip - Can you post a screen shot image of what this looks like?
- Mark as New
- Bookmark
- Subscribe
- Mute
- Subscribe to RSS Feed
- Permalink
- Report Inappropriate Content
Hi Tyler,
Attached is a screendump of the Gantt-waterfall. It might need some space if one truly wants to look at the full picture of all reloads and there are many tasks. I'm sure there can be improvements on the visualisation itself (I had to cut/truncate the image in order not to share potentially confidential data, but it is the "Task Name" that is on the left-hand side). At least a start to be able to look at when tasks start and end and what is running concurrently as well as when the slots are to be able to squeeze in other reload tasks across that server/machine.
Hope it helps. Cheerio,
Cheenu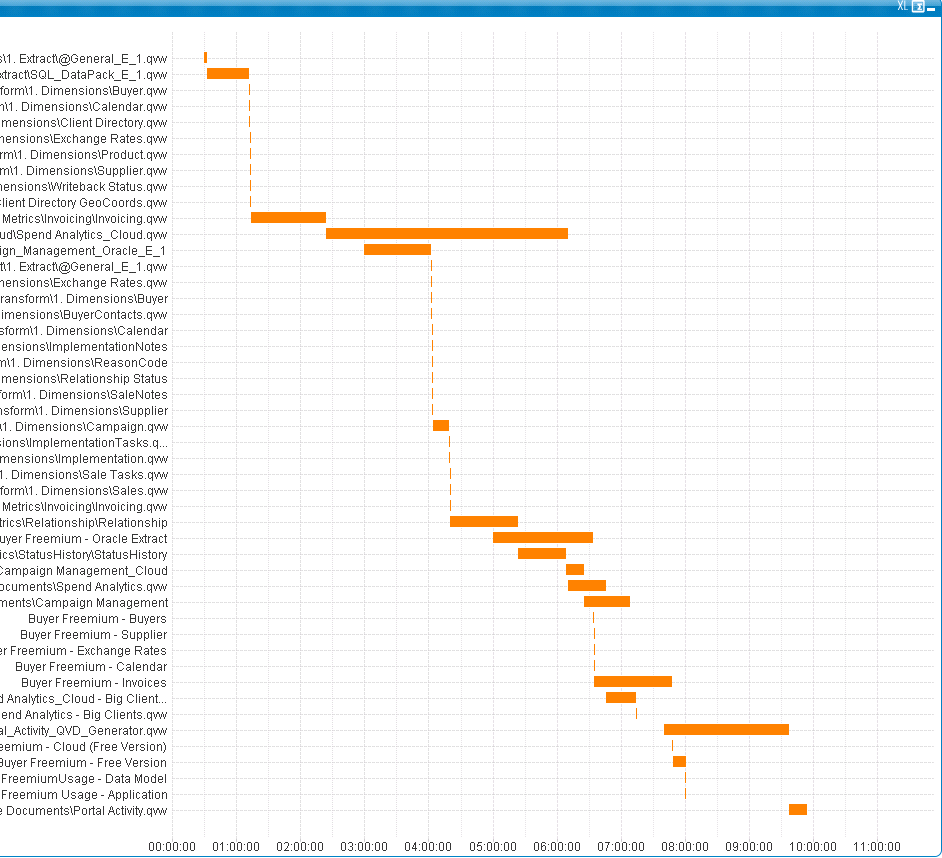
- Mark as New
- Bookmark
- Subscribe
- Mute
- Subscribe to RSS Feed
- Permalink
- Report Inappropriate Content
Hi Tyler,
I am not able to scan subfolders in governance dashboard.
I have all applicationd deployed in one main floder like D:\\Qvsource
and it contains sub folders like D:\\Qvsource\applications..
But it is not scanning all sub folders.
Kindly do the needful
- Mark as New
- Bookmark
- Subscribe
- Mute
- Subscribe to RSS Feed
- Permalink
- Report Inappropriate Content
Yes, I am sorry. This is a known bug with 2.0.2. See https://community.qlik.com/message/1246814#1246814 to get a 2.0.3 early release app.
- Mark as New
- Bookmark
- Subscribe
- Mute
- Subscribe to RSS Feed
- Permalink
- Report Inappropriate Content
Hi Tyler
I would like to know if there is any way to add a new input box object in the configuration section. I need to load xls extension files and contain them in a QVD
Thank you
- « Previous Replies
-
- 1
- 2
- Next Replies »