Unlock a world of possibilities! Login now and discover the exclusive benefits awaiting you.
- Qlik Community
- :
- All Forums
- :
- QlikView Administration
- :
- Need help in sorting the value in descending order
- Subscribe to RSS Feed
- Mark Topic as New
- Mark Topic as Read
- Float this Topic for Current User
- Bookmark
- Subscribe
- Mute
- Printer Friendly Page
- Mark as New
- Bookmark
- Subscribe
- Mute
- Subscribe to RSS Feed
- Permalink
- Report Inappropriate Content
Need help in sorting the value in descending order
Hi All,
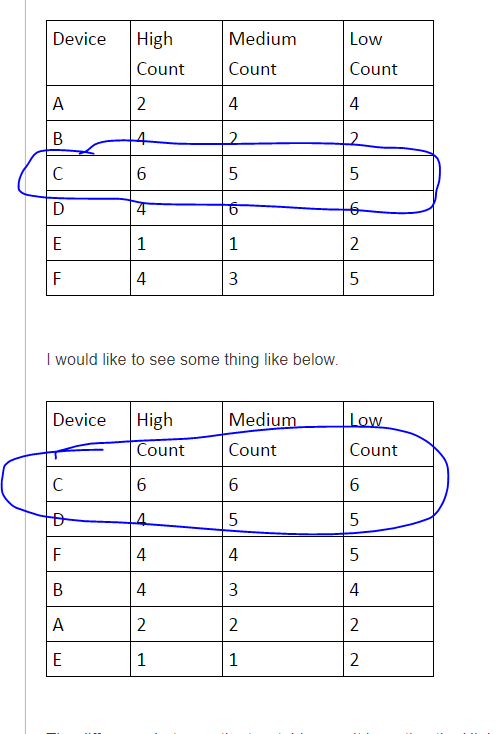
Thank you for helping me in some of the question which I posted earlier. I've a new requirement in our project where we need to sort the values from highest to low. Below tables tells you in detail of what I'm getting and what I would like to see.
I've a table which has device information and some columns with expression as 'SUM' and below is the table which I'm getting.
| Device | High Count | Medium Count | Low Count |
| A | 2 | 4 | 4 |
| B | 4 | 2 | 2 |
| C | 6 | 5 | 5 |
| D | 4 | 6 | 6 |
| E | 1 | 1 | 2 |
| F | 4 | 3 | 5 |
I would like to see some thing like below.
| Device | High Count | Medium Count | Low Count |
| C | 6 | 6 | 6 |
| D | 4 | 5 | 5 |
| F | 4 | 4 | 5 |
| B | 4 | 3 | 4 |
| A | 2 | 2 | 2 |
| E | 1 | 1 | 2 |
The difference between the two tables are it is sorting the High, Medium and Low from Highest to Lowest and here 'Device' is my column name and High count is 'SUM(HIGH'), Medium Count is 'SUM(MEDIUM)' and Low Count is 'SUM(LOW)' and I'm using Pivot table in my app.
Regards,
Vikas
- Mark as New
- Bookmark
- Subscribe
- Mute
- Subscribe to RSS Feed
- Permalink
- Report Inappropriate Content
The value of C changed because of the sorting?
- Mark as New
- Bookmark
- Subscribe
- Mute
- Subscribe to RSS Feed
- Permalink
- Report Inappropriate Content
I think he wants to sort on HighCount..
- Mark as New
- Bookmark
- Subscribe
- Mute
- Subscribe to RSS Feed
- Permalink
- Report Inappropriate Content
Make sense, but why are Medium, Low dependent on Dimension?
- Mark as New
- Bookmark
- Subscribe
- Mute
- Subscribe to RSS Feed
- Permalink
- Report Inappropriate Content
It should not right? Cos he has expressions for High Medium and Low columns.
- Mark as New
- Bookmark
- Subscribe
- Mute
- Subscribe to RSS Feed
- Permalink
- Report Inappropriate Content
So he wants to sort the high with dependent dimension but Medium and Low as their own sorting ignoring dimensions.
- Mark as New
- Bookmark
- Subscribe
- Mute
- Subscribe to RSS Feed
- Permalink
- Report Inappropriate Content
But that just doesn't make any sense.... in a single chart... if you do this, then you are giving incorrect information to your users 
- Mark as New
- Bookmark
- Subscribe
- Mute
- Subscribe to RSS Feed
- Permalink
- Report Inappropriate Content
Absolutely. He has to correct the given information based on this discussion we had. 🙂