Unlock a world of possibilities! Login now and discover the exclusive benefits awaiting you.
- Qlik Community
- :
- All Forums
- :
- QlikView Administration
- :
- Server memory usage per app
- Subscribe to RSS Feed
- Mark Topic as New
- Mark Topic as Read
- Float this Topic for Current User
- Bookmark
- Subscribe
- Mute
- Printer Friendly Page
- Mark as New
- Bookmark
- Subscribe
- Mute
- Subscribe to RSS Feed
- Permalink
- Report Inappropriate Content
Server memory usage per app
Hi,
I want to determine the memory usage of a QlikView app before it is published to our production server. I compared the memory statistics/usage app with the actual memory consumption on our test server (tested this with restarting the QVS service and starting only 1 app) but the results are not the same at all. Below a table with my results:
| App | Check | Result (in MB) |
|---|---|---|
| App 1 | File Size | 100 |
| File Size uncompressed | 700 | |
| Memory usage analyzer app | 700 | |
| Server Memory usage | 3.800 | |
| App 2 | File Size | 100 |
| File Size uncompressed | 200 | |
| Memory usage analyzer app | 200 | |
| Server Memory usage | 1.400 | |
| App 3 | File Size | 5 |
| File Size uncompressed | 13 | |
| Memory usage analyzer app | 15 | |
| Server Memory usage | 200 | |
| App 4 | File Size | 60 |
| File Size uncompressed | 180 | |
| Memory usage analyzer app | 187 | |
| Server Memory usage | 510 |
Looking at this table it looks like the memory analyzer app shows just the size of the app when compression is set to Off. Also looking at this table it is almost impossible to determine the server memory consumption before an app is published to this server.
Any thoughts on this? Does anybody know another way to determine the actual memory usage of an app?
Thanks,
Danny
- Tags:
- qlikview_deployment
- Mark as New
- Bookmark
- Subscribe
- Mute
- Subscribe to RSS Feed
- Permalink
- Report Inappropriate Content
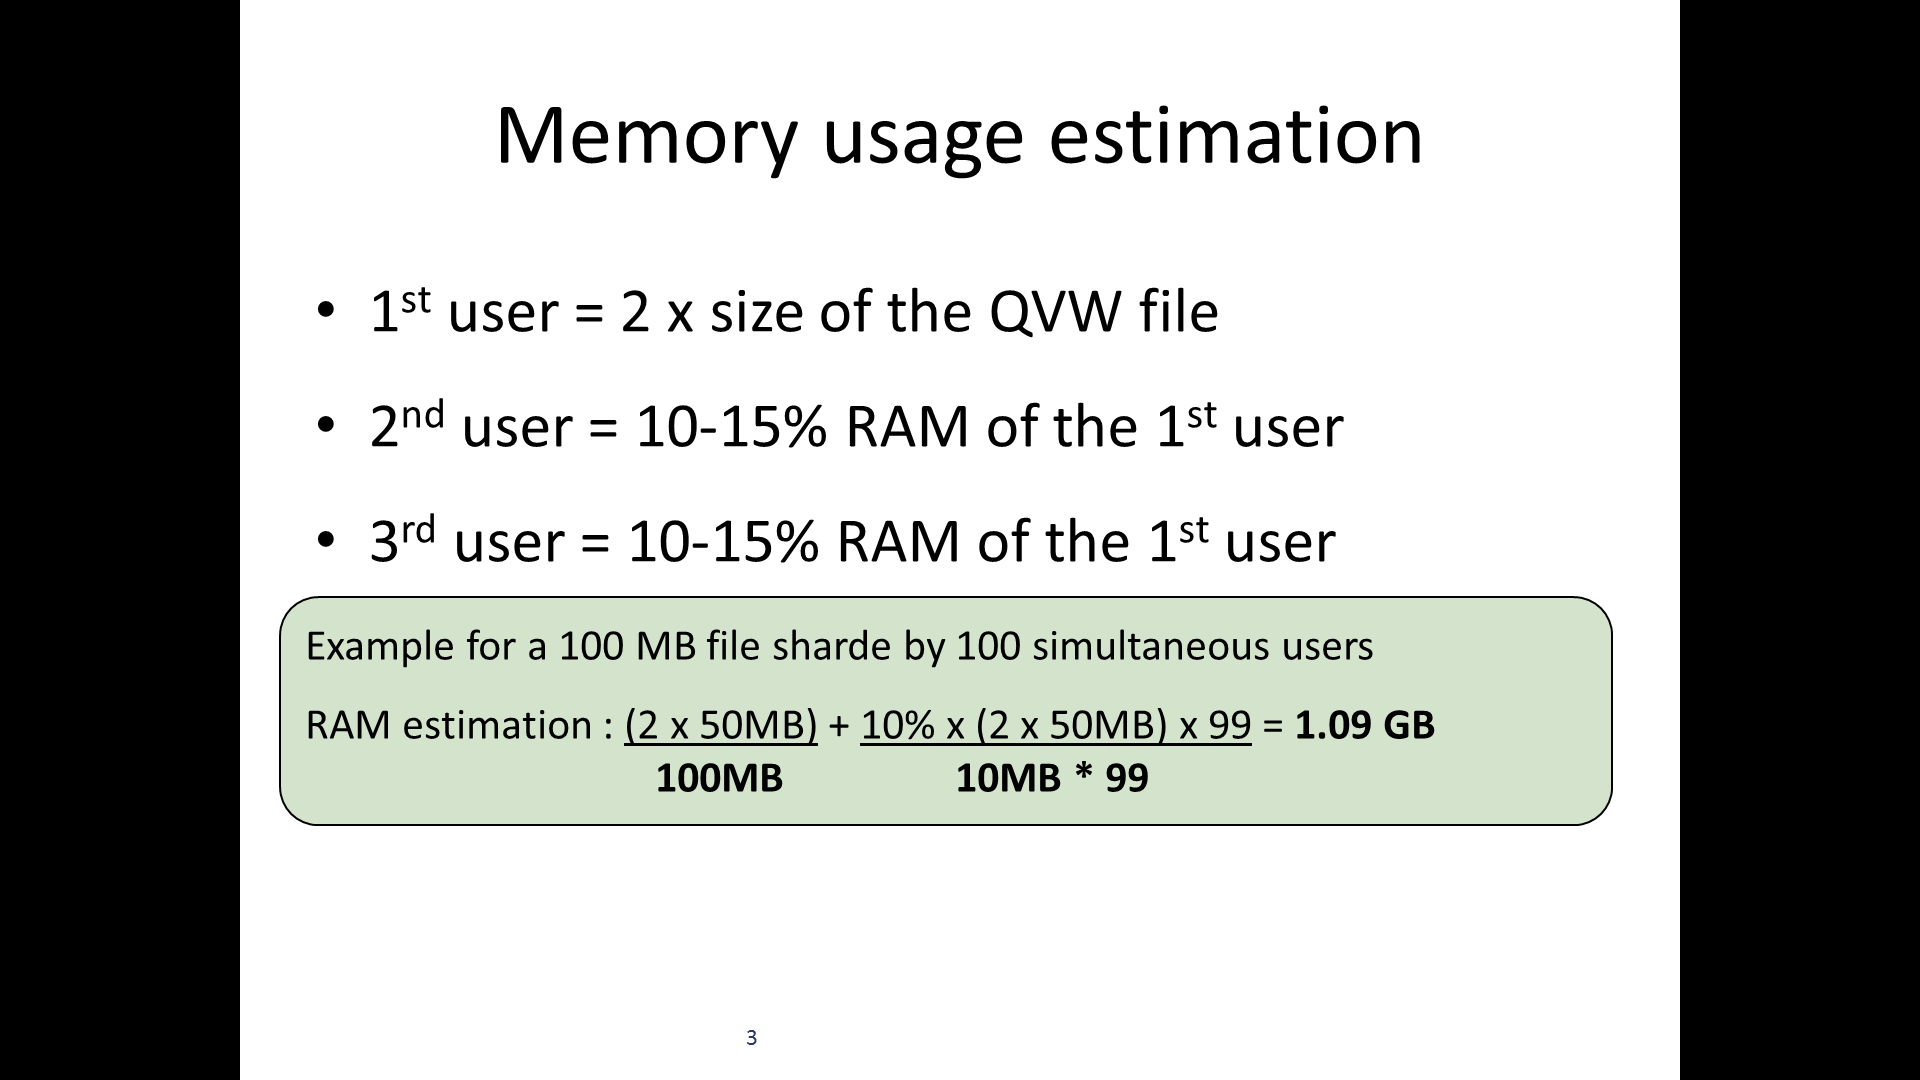
Hi Danny, it's hard to know the RAM consumption as it depends of many factors, some related to the way you create the data model and the relationships.
This app can give you an approximation: RAM Calculation QlikView App
- Mark as New
- Bookmark
- Subscribe
- Mute
- Subscribe to RSS Feed
- Permalink
- Report Inappropriate Content
Thanks Ruben. This helps me a little.
But, isn't there a way to analyze the app (like the Memory Statistics app does) so I can determine the memory, the app will consume for 1 user?
- Mark as New
- Bookmark
- Subscribe
- Mute
- Subscribe to RSS Feed
- Permalink
- Report Inappropriate Content
What is "memory usage"? Does it include memory for users (each user adds 10% to the memory footprint)? Does it include the cache extension and QVS overhead? Does it include the growth caused by the reload of ever growing source tables?
The optimal calculation of memory requirements is largely based on estimates (see Ruben's suggested document), experience and continuous run-time measurements. It's not an exact science, unfortunately.
Peter
- Mark as New
- Bookmark
- Subscribe
- Mute
- Subscribe to RSS Feed
- Permalink
- Report Inappropriate Content
Maybe some if this posts gives you more info to analyze:
- Mark as New
- Bookmark
- Subscribe
- Mute
- Subscribe to RSS Feed
- Permalink
- Report Inappropriate Content
Hi
The usage of the memory ram I think is variable because depend of the server, for example if the server is virtual, the process that windows have or if you have another tools running in the server.
Also the performance can change depending of your bios settings, I share you some information this topic
Quick tips #8 - Server Settings For Best Performance
Check the app that I share you, can be useful for you
Regards
- Mark as New
- Bookmark
- Subscribe
- Mute
- Subscribe to RSS Feed
- Permalink
- Report Inappropriate Content
I'm not sure what tool you were using as the "Memory Usage analyzer app", but it could be that is was calculating space for the data only, and not the sheet objects.
Document Analyzer
Qlikview Cookbook: QV Document Analyzer http://qlikviewcookbook.com/recipes/download-info/document-analyzer/
does a fair job of calculating what is called the "RAM Footprint" on the Summary sheet, which includes both the data and the sheet objects. It also identifies the per user increment on the Memory sheet.
Note that as soon as you open a document in QVS, results start getting added to the cache. So just looking at QVS memory in task manager is not an accurate measure of the baseline needed for an app. However, I think it's still a useful number because your app will need some cache when it's actually used -- so I think using actual QVS memory for planning make some sense.
-Rob
- Mark as New
- Bookmark
- Subscribe
- Mute
- Subscribe to RSS Feed
- Permalink
- Report Inappropriate Content
Thanks for your answer. I used the Document Analyzer for app number 2 (in my overview above) and the RAM footprint result is 230MB. This differs a lot with the memory usage on the server (1.400MB). Is this caused by 1.100MB of results in cache then?
Any idea how to get better memory analyzing results?
Thanks,
Danny
- Mark as New
- Bookmark
- Subscribe
- Mute
- Subscribe to RSS Feed
- Permalink
- Report Inappropriate Content
What version of Document Analyzer?
- Mark as New
- Bookmark
- Subscribe
- Mute
- Subscribe to RSS Feed
- Permalink
- Report Inappropriate Content
The latest version from your link, version 2.6!