Unlock a world of possibilities! Login now and discover the exclusive benefits awaiting you.
- Qlik Community
- :
- All Forums
- :
- QlikView Administration
- :
- compare time instruction IF
- Subscribe to RSS Feed
- Mark Topic as New
- Mark Topic as Read
- Float this Topic for Current User
- Bookmark
- Subscribe
- Mute
- Printer Friendly Page
- Mark as New
- Bookmark
- Subscribe
- Mute
- Subscribe to RSS Feed
- Permalink
- Report Inappropriate Content
compare time instruction IF
Hello
I am new to the forum, I need help, I have a table of two fields name and arrival time, I will wish to display all persons arriving from 7am: 45 red and one in green.
example
Header 1 | Header 2 |
pat | 05:45 |
nav | 07:00 |
be | 07:45 |
Hugues | 10:50 |
but I do not know how to put in my expression
But I thought the If...Then...Else Statement,
rgb(255,255,255), rgb(0,255,0),hour(7),minute(45)
Accepted Solutions
- Mark as New
- Bookmark
- Subscribe
- Mute
- Subscribe to RSS Feed
- Permalink
- Report Inappropriate Content
First, make sure that you've read in the time field correctly:
http://community.qlik.com/blogs/qlikviewdesignblog/2012/06/07/get-the-dates-right
Then, you can create a straight table chart with field 'name' as dimension and
=only([arrival time])
as expression, assuming one arrival time per name value.
Then you've got two options for colour the expression:
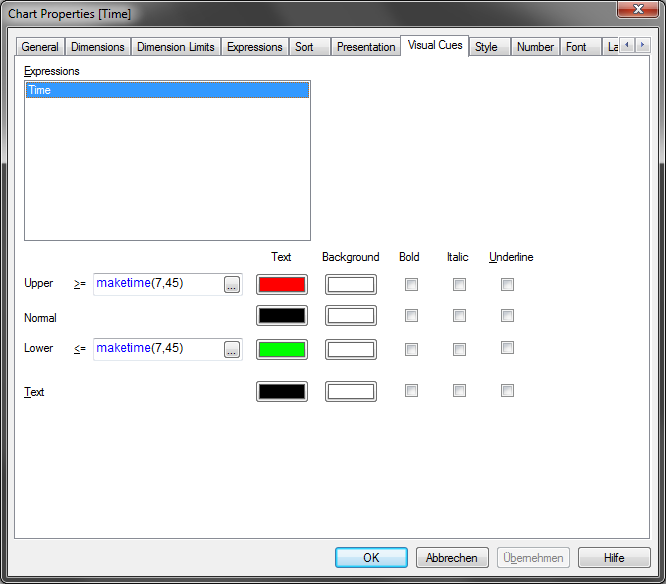
Either use the old-style visual cues tab in chart properties, and enter an expression like
maketime(7,45)
in the entry field for upper and lower limit (chosing an appropriate colour also).

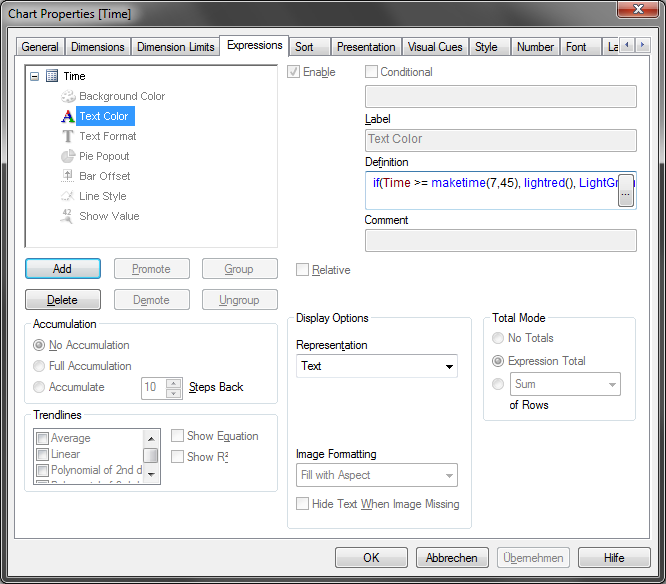
Or, second option, use a Text Color attribute expression in expression tab:

Expression could look like
=if( [arrival time] >= maketime(7,45), lightred(), lightgreen() )
- Mark as New
- Bookmark
- Subscribe
- Mute
- Subscribe to RSS Feed
- Permalink
- Report Inappropriate Content
First, make sure that you've read in the time field correctly:
http://community.qlik.com/blogs/qlikviewdesignblog/2012/06/07/get-the-dates-right
Then, you can create a straight table chart with field 'name' as dimension and
=only([arrival time])
as expression, assuming one arrival time per name value.
Then you've got two options for colour the expression:
Either use the old-style visual cues tab in chart properties, and enter an expression like
maketime(7,45)
in the entry field for upper and lower limit (chosing an appropriate colour also).

Or, second option, use a Text Color attribute expression in expression tab:

Expression could look like
=if( [arrival time] >= maketime(7,45), lightred(), lightgreen() )
- Mark as New
- Bookmark
- Subscribe
- Mute
- Subscribe to RSS Feed
- Permalink
- Report Inappropriate Content
Thank swuehl you it works