Unlock a world of possibilities! Login now and discover the exclusive benefits awaiting you.
- Qlik Community
- :
- All Forums
- :
- QlikView App Dev
- :
- 2 colored line in Line Chart
- Subscribe to RSS Feed
- Mark Topic as New
- Mark Topic as Read
- Float this Topic for Current User
- Bookmark
- Subscribe
- Mute
- Printer Friendly Page
- Mark as New
- Bookmark
- Subscribe
- Mute
- Subscribe to RSS Feed
- Permalink
- Report Inappropriate Content
2 colored line in Line Chart
Is it possible to use the Colors tab and/or Background Color/Line Style attributes to assign multiple colors to a single line as shown in the attached chart?
Thanks!
Accepted Solutions
- Mark as New
- Bookmark
- Subscribe
- Mute
- Subscribe to RSS Feed
- Permalink
- Report Inappropriate Content
This is a continuous line chart (numeric / date dimension) and i've added a colormix1() color gradient with the following formula.
it takes a value between 0 and 1, so the date on the x axis is a ratio of the min->max range. Left side is yellow() and right side is red().
is this helpful ?
ColorMix1(
(Date - min( total Date))
/
( max( total Date) - min(total Date) )
,yellow(),red())

- Mark as New
- Bookmark
- Subscribe
- Mute
- Subscribe to RSS Feed
- Permalink
- Report Inappropriate Content
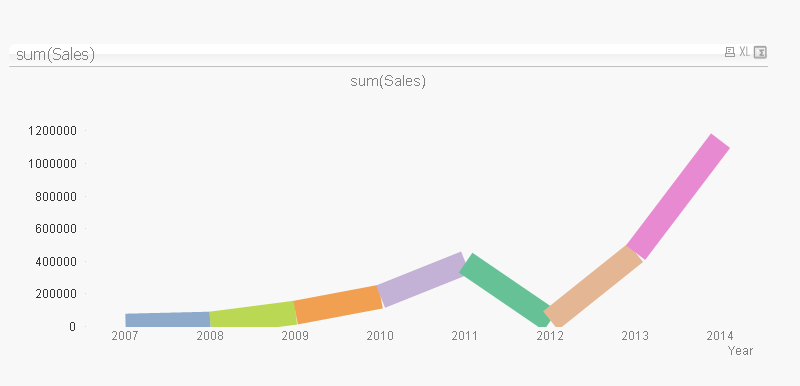
How about like this ? its a regular line chart with 'multicolored' enabled and a line style of '<W8>'
 \\
\\
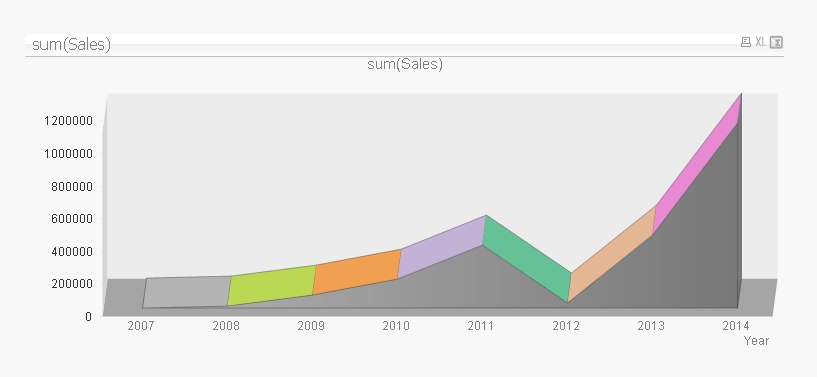
or 3D ? ![]()

- Mark as New
- Bookmark
- Subscribe
- Mute
- Subscribe to RSS Feed
- Permalink
- Report Inappropriate Content
I believe that each of those segments is a seperate line. If you look at my example, each line needs to to have two colors and they need to be in a gradient as they move across the line. I could create two lines for every line, but it wouldn't allow for the gradients and would not be ideal as every line in my data would be split in two.
- Mark as New
- Bookmark
- Subscribe
- Mute
- Subscribe to RSS Feed
- Permalink
- Report Inappropriate Content
This is a continuous line chart (numeric / date dimension) and i've added a colormix1() color gradient with the following formula.
it takes a value between 0 and 1, so the date on the x axis is a ratio of the min->max range. Left side is yellow() and right side is red().
is this helpful ?
ColorMix1(
(Date - min( total Date))
/
( max( total Date) - min(total Date) )
,yellow(),red())

- Mark as New
- Bookmark
- Subscribe
- Mute
- Subscribe to RSS Feed
- Permalink
- Report Inappropriate Content
You can probably use colormix1 to accomplish what you need, assuming you have just 2 colors in your gradient (which it seems like you do from your screenshot):
ColorMix1(rand(),blue(),red())
You can use the first parameter to determine how much closer the color should be to the first color vs. the second.
Regards,
Vlad