Unlock a world of possibilities! Login now and discover the exclusive benefits awaiting you.
- Qlik Community
- :
- All Forums
- :
- QlikView App Dev
- :
- 3 Months Average in Straight Table ?
- Subscribe to RSS Feed
- Mark Topic as New
- Mark Topic as Read
- Float this Topic for Current User
- Bookmark
- Subscribe
- Mute
- Printer Friendly Page
- Mark as New
- Bookmark
- Subscribe
- Mute
- Subscribe to RSS Feed
- Permalink
- Report Inappropriate Content
3 Months Average in Straight Table ?
Hi Techies,
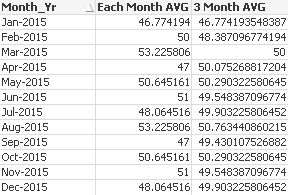
I need to find average of 3 months in a straight table. Here Month_Yr is dimension. I have measure field day wise from source table.
Example:
For Month_Yr "Mar-2015", calculate average for values from 01-Jan-2015 to 31-Mar-2015.
For Month_Yr "Apr-2015", calculate average for values from 01-Feb-2015 to 30-Apr-2015 and so on.
Here I have attached Test files for your reference.
- « Previous Replies
-
- 1
- 2
- Next Replies »
Accepted Solutions
- Mark as New
- Bookmark
- Subscribe
- Mute
- Subscribe to RSS Feed
- Permalink
- Report Inappropriate Content
Script:
Sample:
LOAD Date,
Floor(MonthEnd(Date)) - MonthStart(Date, -2) + 1 as Days,
Measure,
Month(Date)&'-'&Year(Date) as Month_Yr
FROM
[Sample Data (1).xlsx]
(ooxml, embedded labels, table is Sheet1);
Where Days field will create a field which will help us know how many days do we need to go back for each month (which are not static). So months will have 91, 90, or 89 days
Once you get this under your belt, the next step is to use the following formula, but this will only work in QV12 (because sorting in Aggr is only available in QV12 or Qlik Sense The sortable Aggr function is finally here!)
=Aggr(If(Date = Floor(MonthEnd(Date)), RangeAvg(Above(Avg(Measure), 0, Days))), (Date, (NUMERIC)))
If you don't have QV12, you will need to sort the date in the script, which might be difficult if you can bring your master calendar before anything else. If you can do this, then you can use this:
=Aggr(If(Date = Floor(MonthEnd(Date)), RangeAvg(Above(Avg(Measure), 0, Days))), Date)
Regular expression works here because your data was well sorted in the Excel file, which might not be true for your real data.
HTH
Best,
Sunny
- Mark as New
- Bookmark
- Subscribe
- Mute
- Subscribe to RSS Feed
- Permalink
- Report Inappropriate Content
Do you need this in your load script of straight table?
If a post helps to resolve your issue, please accept it as a Solution.
- Mark as New
- Bookmark
- Subscribe
- Mute
- Subscribe to RSS Feed
- Permalink
- Report Inappropriate Content
Hi Vineeth,
I need this in straight table without making changes in script.
- Mark as New
- Bookmark
- Subscribe
- Mute
- Subscribe to RSS Feed
- Permalink
- Report Inappropriate Content
try this expression
=RangeAvg( above(avg(Measure),0,3))

- Mark as New
- Bookmark
- Subscribe
- Mute
- Subscribe to RSS Feed
- Permalink
- Report Inappropriate Content
Hi Kushal,
For example,
Month1 => 10, 20, 30, 40
Month2 => 50, 60, 70
Month3 => 90, 10, 20, 30
Your expression does this:
Month1=> (10+20+30+40)/4 => (100/4) => 25
Month2=> (50+60+70)/3 => (180/3) => 60
Month3=> (90+10+20+30)/4 => (150/4) => 37.5
then, (25+60+37.5)/3 => (122.5/3) = 40.8333...
But actually it should take average for 3 months with day wise values. Therefore it should do,
(10+20+30+40+50+60+70+90+10+20+30) / 11 = 39.0909...
Here 39.0909 is the required result.
How can I achieve this.........
- Mark as New
- Bookmark
- Subscribe
- Mute
- Subscribe to RSS Feed
- Permalink
- Report Inappropriate Content
I done the logic as per your result needed excel file which is matching with your needed output
- Mark as New
- Bookmark
- Subscribe
- Mute
- Subscribe to RSS Feed
- Permalink
- Report Inappropriate Content
what is the expected output you need for Mar - 2015?
- Mark as New
- Bookmark
- Subscribe
- Mute
- Subscribe to RSS Feed
- Permalink
- Report Inappropriate Content
Hi Kushal,
Required Result
Result from your expression

Values after decimal point does not match... Because average has to be applied as per the above example.
- Mark as New
- Bookmark
- Subscribe
- Mute
- Subscribe to RSS Feed
- Permalink
- Report Inappropriate Content
You want to show last months data while selection or Constant?
- Mark as New
- Bookmark
- Subscribe
- Mute
- Subscribe to RSS Feed
- Permalink
- Report Inappropriate Content
Script:
Sample:
LOAD Date,
Floor(MonthEnd(Date)) - MonthStart(Date, -2) + 1 as Days,
Measure,
Month(Date)&'-'&Year(Date) as Month_Yr
FROM
[Sample Data (1).xlsx]
(ooxml, embedded labels, table is Sheet1);
Where Days field will create a field which will help us know how many days do we need to go back for each month (which are not static). So months will have 91, 90, or 89 days
Once you get this under your belt, the next step is to use the following formula, but this will only work in QV12 (because sorting in Aggr is only available in QV12 or Qlik Sense The sortable Aggr function is finally here!)
=Aggr(If(Date = Floor(MonthEnd(Date)), RangeAvg(Above(Avg(Measure), 0, Days))), (Date, (NUMERIC)))
If you don't have QV12, you will need to sort the date in the script, which might be difficult if you can bring your master calendar before anything else. If you can do this, then you can use this:
=Aggr(If(Date = Floor(MonthEnd(Date)), RangeAvg(Above(Avg(Measure), 0, Days))), Date)
Regular expression works here because your data was well sorted in the Excel file, which might not be true for your real data.
HTH
Best,
Sunny
- « Previous Replies
-
- 1
- 2
- Next Replies »