Unlock a world of possibilities! Login now and discover the exclusive benefits awaiting you.
Announcements
Qlik Open Lakehouse is Now Generally Available! Discover the key highlights and partner resources here.
- Qlik Community
- :
- All Forums
- :
- QlikView App Dev
- :
- 3 expressions on 1 graph
Options
- Subscribe to RSS Feed
- Mark Topic as New
- Mark Topic as Read
- Float this Topic for Current User
- Bookmark
- Subscribe
- Mute
- Printer Friendly Page
Turn on suggestions
Auto-suggest helps you quickly narrow down your search results by suggesting possible matches as you type.
Showing results for
Not applicable
2014-10-20
01:35 PM
- Mark as New
- Bookmark
- Subscribe
- Mute
- Subscribe to RSS Feed
- Permalink
- Report Inappropriate Content
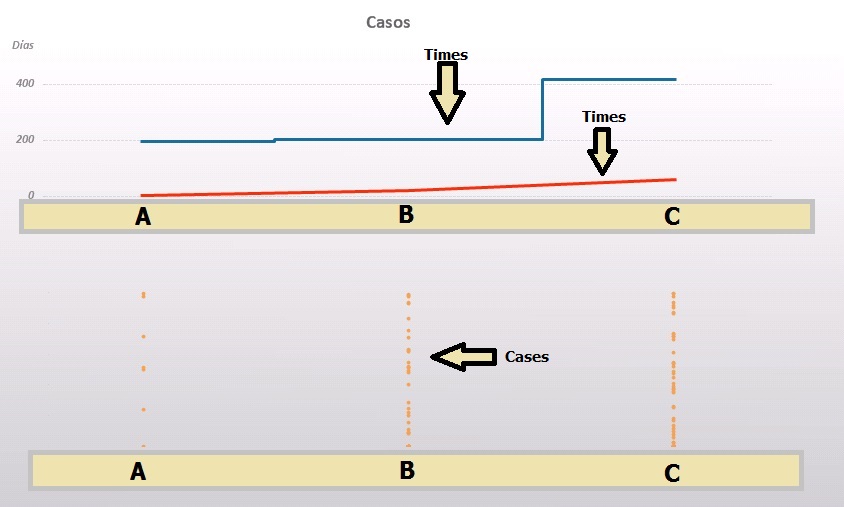
3 expressions on 1 graph
I have 2 expressions in a graph, and 1 in the other graph. The two lines represent time, and the points of the second graph represent each case with their times.
As I can plot the three expressions in a graph.
353 Views
1 Reply
Not applicable
2014-10-20
02:04 PM
Author
- Mark as New
- Bookmark
- Subscribe
- Mute
- Subscribe to RSS Feed
- Permalink
- Report Inappropriate Content
Hello,
I'm trying to accomplish the same thing.
Is there any way to do it?
Thank you!!!
222 Views