Unlock a world of possibilities! Login now and discover the exclusive benefits awaiting you.
- Qlik Community
- :
- All Forums
- :
- QlikView App Dev
- :
- A chart to show the average of a parent dimension ...
- Subscribe to RSS Feed
- Mark Topic as New
- Mark Topic as Read
- Float this Topic for Current User
- Bookmark
- Subscribe
- Mute
- Printer Friendly Page
- Mark as New
- Bookmark
- Subscribe
- Mute
- Subscribe to RSS Feed
- Permalink
- Report Inappropriate Content
A chart to show the average of a parent dimension value
Hi,
I'm curious to see if this seemingly easy, but in reality quite of a problem can be solved.
I have a chart showing
- Store as a dimension
- this year's item availability as a measure 1 (all items, fact fields as binary fields e.g.1 for available or 0 for unavailable item):
- Sum(AvailableItems)/Sum(WholeOffering)
- last year's item availability as a measure 2:
- Sum({$<Year={$(=max(Year)-1)}>}AvailableItems)/Sum({$<Year={$(=max(Year)-1)}>}WholeOffering)
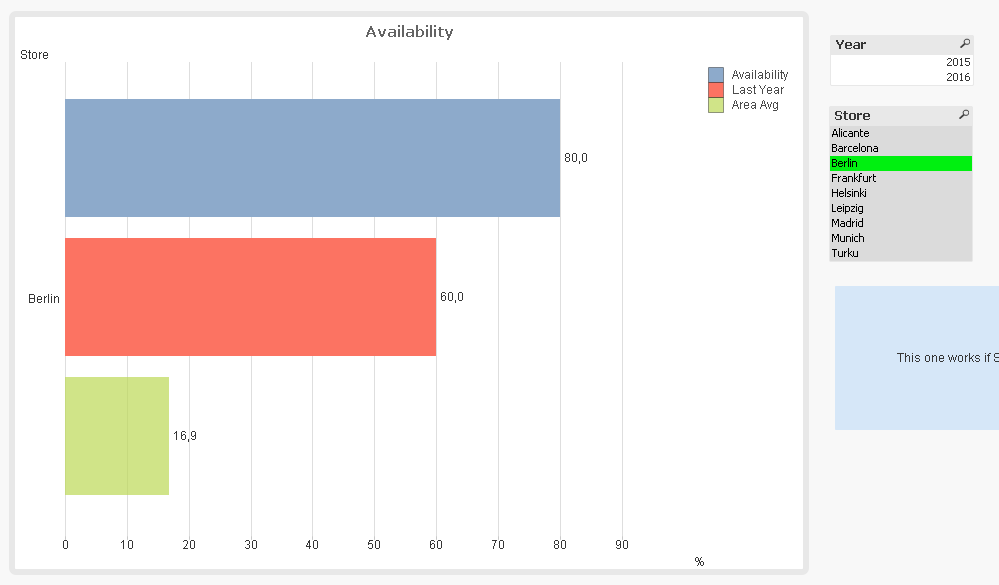
With this data the chart works fine and the measures are displayed like they should be. But I want to add another bar showing the store area average as a third expression.
Below an example of the Store dimension is shown in a table. Each Store belongs to an Area, e.g. Store values Madrid, Barcelona, Alicante belong to Spain. Store dimension is linked to the fact table with StoreID.
| StoreID | Store | Area | StoresInArea |
|---|---|---|---|
| 1 | Barcelona | Spain | 3 |
| 2 | Madrid | Spain | 3 |
| 3 | Alicante | Spain | 3 |
| 4 | Helsinki | Finland | 2 |
| 5 | Turku | Finland | 2 |
Now I want to show an Area average. If I select one Store from the dimension, this expression gives me the correct answer in a TextBox:
- (Sum({$<Area=P(Area), Store=>}AvailableItems)/ sum(StoresInArea)) / (Sum({$<Area=P(Area), Store=>}WholeOffering)/Sum(StoresInArea))
The outcome should look like this:

How do I manage it in Qlikview?
Thank you in advance,
Tiia
Accepted Solutions
- Mark as New
- Bookmark
- Subscribe
- Mute
- Subscribe to RSS Feed
- Permalink
- Report Inappropriate Content
Try this:
Aggr(Avg(TOTAL <Area> Aggr((Sum({$<Area=P(Area), Store=>}AvailableItems)/ Sum({$<Area=P(Area), Store=>}WholeOffering)) / sum(StoresInArea)*100, Store, Area)), Store, Area)
- Mark as New
- Bookmark
- Subscribe
- Mute
- Subscribe to RSS Feed
- Permalink
- Report Inappropriate Content
Try this:
Aggr(Avg(TOTAL <Area> Aggr((Sum({$<Area=P(Area), Store=>}AvailableItems)/ Sum({$<Area=P(Area), Store=>}WholeOffering)) / sum(StoresInArea)*100, Store, Area)), Store, Area)
- Mark as New
- Bookmark
- Subscribe
- Mute
- Subscribe to RSS Feed
- Permalink
- Report Inappropriate Content
Hi Sunny T!
I tweaked the expression just a little bit (it seemed that the StoresInArea field wasn't needed anymore when AGGR is used) and now it works perfectly!
A BIG thank you 
Aggr(Avg(TOTAL <Area> Aggr((Sum({$<Area=P(Area), Store=>}AvailableItems)/ Sum({$<Area=P(Area), Store=>}WholeOffering))*100, Store, Area)), Store, Area)
- Mark as New
- Bookmark
- Subscribe
- Mute
- Subscribe to RSS Feed
- Permalink
- Report Inappropriate Content
Hi Tiia,
The expressions in this straight table may be what you are looking for.
| Store | Sum(AvailableItems) /Sum( WholeOffering) | Sum({$<Year = {2015}>}AvailableItems) /Sum({$<Year = {2015}>} WholeOffering) | Aggr(NODISTINCT Sum(AvailableItems),Area) /Aggr(NODISTINCT Sum( WholeOffering),Area) |
|---|---|---|---|
| 0.57777777777778 | 0.55555555555556 | ||
| Frankfurt | 0.5 | 0.6 | 0.675 |
| Leipzig | 0.7 | 0.6 | 0.675 |
| Munich | 0.7 | 0.6 | 0.675 |
| Berlin | 0.8 | 0.6 | 0.675 |
| Turku | 0.6 | 0.4 | 0.55 |
| Helsinki | 0.5 | 0.4 | 0.55 |
| Alicante | 0.3 | 0.4 | 0.46666666666667 |
| Barcelona | 0.4 | 0.6 | 0.46666666666667 |
| Madrid | 0.7 | 0.8 | 0.46666666666667 |
You can make it into a bar chart and sort by the expression =Area & '|' & Store
It looks like:

Good luck!
Andrew
- Mark as New
- Bookmark
- Subscribe
- Mute
- Subscribe to RSS Feed
- Permalink
- Report Inappropriate Content
Thank you! I'll have a look at this as well.
- Mark as New
- Bookmark
- Subscribe
- Mute
- Subscribe to RSS Feed
- Permalink
- Report Inappropriate Content
No problem at all
I am glad I was able to help
- Mark as New
- Bookmark
- Subscribe
- Mute
- Subscribe to RSS Feed
- Permalink
- Report Inappropriate Content
Hi Sunny,
I noticed a small flaw in the expression in case a user selects a Store. The expression works fine if no Store is selected (or a certain Area is selected) and all stores wth their averages are displayed nicely in the chart . If a Store is selected, then the average should still show the same area average (ignore the Store selection), but now it shows something entirely different. Where should the " Store = " -set analysis be placed in the Expression? I couldn't figure it out 😕
Thanks in advance!
Aggr(Avg(TOTAL <Area> Aggr((Sum({$<Area=P(Area), Store=>}AvailableItems)/ Sum({$<Area=P(Area), Store=>}WholeOffering))*100, Store, Area)), Store, Area)
- Mark as New
- Bookmark
- Subscribe
- Mute
- Subscribe to RSS Feed
- Permalink
- Report Inappropriate Content
Try with these two changes:
Aggr(Avg({<Store>}TOTAL <Area> Aggr((Sum({$<Area=P(Area), Store=>}AvailableItems)/ Sum({$<Area=P(Area), Store=>}WholeOffering)) / Sum({<Store>}StoresInArea)*100, Store, Area)), Store, Area)