Unlock a world of possibilities! Login now and discover the exclusive benefits awaiting you.
- Qlik Community
- :
- All Forums
- :
- QlikView App Dev
- :
- AGGR Function Help
- Subscribe to RSS Feed
- Mark Topic as New
- Mark Topic as Read
- Float this Topic for Current User
- Bookmark
- Subscribe
- Mute
- Printer Friendly Page
- Mark as New
- Bookmark
- Subscribe
- Mute
- Subscribe to RSS Feed
- Permalink
- Report Inappropriate Content
AGGR Function Help
Hi,
I have a question on how to sum up the value using Aggr or any other function
I'm using 4 fields here, [CUST NAME], [MONTH], [PRD CD] & [TOTAL SALES IN PHSICAL CS]
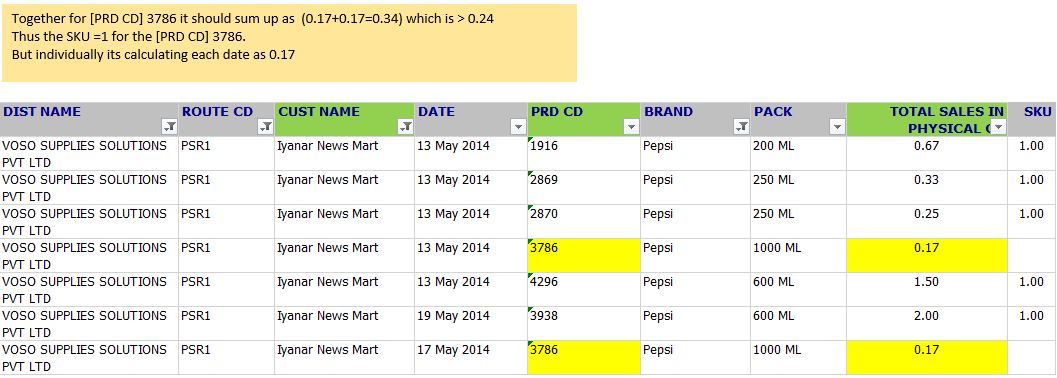
I'm trying to find out how many distinct [PRD CD] have been billed under each [CUST NAME] for that month. The condition i'm using that the [TOTAL SALES IN PHYSICAL CS] should be > 0.24 which means that the product has been covered in that customer.
Since i have [DATE] field also the summing up is not taking place like in pivoted chart.
Here i should get for [PRD CD] = 3786 , the sum of [TOTAL SALES IN PHYSICAL CS] is (0.17+0.17 ) which is > 0.24 Thus the SKU is 1.
But when i use this in a formula in a text object its giving me 0 for the [PRD CD] 3786
Is there anyway i can avoid the split up based on the date alone?
i created a new field in the script
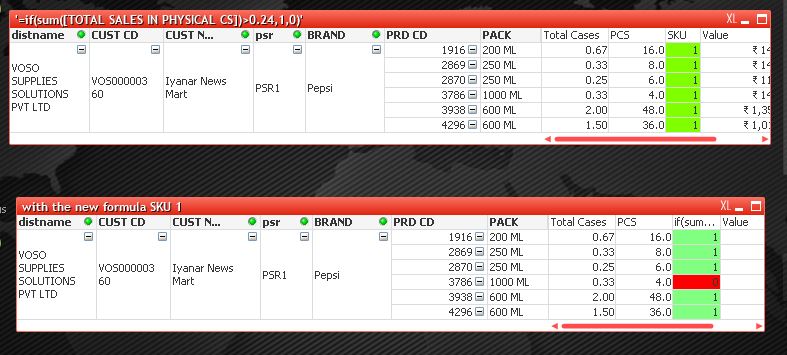
(If([TOTAL SALES IN PHYSICAL CS]>0.24,1,0)) as SKU1
then i tired this formula sum(aggr ( if(Sum(SKU1)>=1,1,0), [CUST NAME] ,[MONTH], [PRD CD]))
I need to show the value in a text box
If you could see in the screenshot below I'm supposed to get 6 as the sum(like the first chart table) but i am getting 5 (shown in the second table)
Thanks in Advance,
Naveen
- Tags:
- new_to_qlikview
- Mark as New
- Bookmark
- Subscribe
- Mute
- Subscribe to RSS Feed
- Permalink
- Report Inappropriate Content
I think you need an expression like:
Sum(Aggr(If(Sum([TOTAL SALES IN PHYSICAL CS])>0.24, Count(distinct [PRD CD])),[CUST NAME],[MONTH]))
This expression will, for each [CUST NAME] and [MONTH] check if the Sum([TOTAL SALES IN PHYSICAL CS]) is above threshold, and if so return the count.
HIC
- Mark as New
- Bookmark
- Subscribe
- Mute
- Subscribe to RSS Feed
- Permalink
- Report Inappropriate Content
Thank you very much! It worked but after i took the month from the date field in the scrip and ignoring the DATE Field itself 