Unlock a world of possibilities! Login now and discover the exclusive benefits awaiting you.
- Qlik Community
- :
- All Forums
- :
- QlikView App Dev
- :
- AGGR Syntax
- Subscribe to RSS Feed
- Mark Topic as New
- Mark Topic as Read
- Float this Topic for Current User
- Bookmark
- Subscribe
- Mute
- Printer Friendly Page
- Mark as New
- Bookmark
- Subscribe
- Mute
- Subscribe to RSS Feed
- Permalink
- Report Inappropriate Content
AGGR Syntax
This should be a simple answer (I hope).
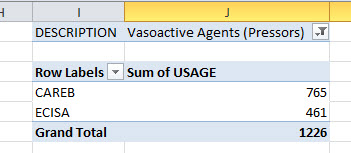
If you select PP_NAME = Vasoactive Agents (Pressors), the Usage chart shows 1226 but the table shows 1226 for each Domain with a total of 2452.
The counts per domain should be CAREB = 765 and ECISA = 461 for a total of 1226
What's wrong with my syntax for Usage Count?
sum(aggr(sum({$}CNT_USAGE),DOMAIN,GOVERNING_CCG,PP_NAME,LAST_REVIEW_DATE))
- Tags:
- aggr
- Mark as New
- Bookmark
- Subscribe
- Mute
- Subscribe to RSS Feed
- Permalink
- Report Inappropriate Content
How are you getting this 765 for CAREB? I tried in your document, it shows 1226? Can you tell me how i can see 765?
- Mark as New
- Bookmark
- Subscribe
- Mute
- Subscribe to RSS Feed
- Permalink
- Report Inappropriate Content
I did a pivot table on the raw data. Maybe there's an issue with my join?
- Mark as New
- Bookmark
- Subscribe
- Mute
- Subscribe to RSS Feed
- Permalink
- Report Inappropriate Content
How do you knwow CAREB should be 765 and ECISA should be 461? Looking at your tables in your data model I don't see what would tell me that.
The join between your EKG_PP and your Usage tables don't take into account the Domain so your total is doubling.
- Mark as New
- Bookmark
- Subscribe
- Mute
- Subscribe to RSS Feed
- Permalink
- Report Inappropriate Content
- Mark as New
- Bookmark
- Subscribe
- Mute
- Subscribe to RSS Feed
- Permalink
- Report Inappropriate Content
For a pivot table in Excel, your data source would be 1 big table. But that's not what your data model looks like in Qlikview. You have the usage and Domain in 2 different tables.
Looking at your script you're taking the 1 excel table and making multiple Qlikview tables but without all the appropriate keys.
In your script, you should create a composite key in your tables of VERSION_PW_CAT_ID & '|' & DOMAIN as %Key
(or better yet, autonumber(VERSION_PW_CAT_ID & '|' & DOMAIN) as %Key
or something similar.
And remove VERSION_PW_CAT_ID from your usage table.
- Mark as New
- Bookmark
- Subscribe
- Mute
- Subscribe to RSS Feed
- Permalink
- Report Inappropriate Content
Did you figure this out?
If so, please close the thread by marking a reply as correct even if it's your own.