Unlock a world of possibilities! Login now and discover the exclusive benefits awaiting you.
- Qlik Community
- :
- All Forums
- :
- QlikView App Dev
- :
- Re: AGGR() and SUM() issues - need some help
- Subscribe to RSS Feed
- Mark Topic as New
- Mark Topic as Read
- Float this Topic for Current User
- Bookmark
- Subscribe
- Mute
- Printer Friendly Page
- Mark as New
- Bookmark
- Subscribe
- Mute
- Subscribe to RSS Feed
- Permalink
- Report Inappropriate Content
AGGR() and SUM() issues - need some help
Hello,
Attached is a QVW file that I created trying to understand the AGGR() and SUM() functions. There are a couple of issues
which I don't understand and can't figure out.
Sales:
LOAD * INLINE
[
Year, SalesRep, Amt
2015, John, 100
2015, John, 200
2015, Mary, 300
2016, John, 400
2016, Mary, 500
];
1) If I pick 2015, why am I not getting data for Mary?
2) If I pick 2016, I am even getting any data at all. Why?
I have a pivot chart with Year and SalesRep under dimension and have an expression in which I do SUM(Amt) GROUP BY Year, SalesRep. Can someone please explain to me what's going with my logic??
Thank you.
- « Previous Replies
- Next Replies »
- Mark as New
- Bookmark
- Subscribe
- Mute
- Subscribe to RSS Feed
- Permalink
- Report Inappropriate Content
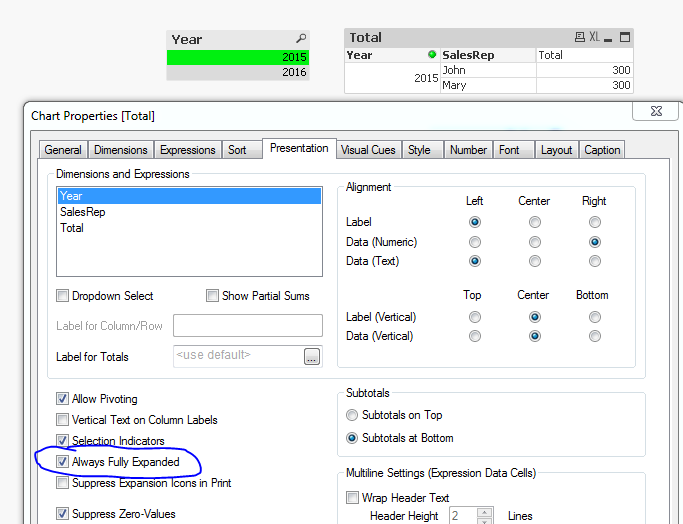
The data was there when you selected 2015, you just needed to make the length of the table bigger. For 2016 the data was not visisble when you have SalesRep field closed because you are using this expression: AGGR(SUM(Amt), Year, SalesRep). If you change to this the things will work: SUM(AGGR(SUM(Amt), Year, SalesRep)) or always keep your pivot table full expanded.


- Mark as New
- Bookmark
- Subscribe
- Mute
- Subscribe to RSS Feed
- Permalink
- Report Inappropriate Content
Seems to work fine, just enlarge the chart area.
Edit:
Sunny is right, you need to add an outer aggregation function to Aggr(), like Sum() or Max() or whatever you need in your chart.
If you don't use an outer aggregation functions, it will default to Only(). Thus, when collapsing your dimensions, the expression will be evaluated in the respective context and will return NULL for 2016 because the expression value differs for the sales persons (in contrary to 2015 where the expression value is the same for both sales persons, hence Only() will return a value),
- Mark as New
- Bookmark
- Subscribe
- Mute
- Subscribe to RSS Feed
- Permalink
- Report Inappropriate Content
When it initially displayed 2015 and John, there was a "+" next to John. I clicked on it to expand the SalesRep. I expected the chart to automatically adjust the height to accommodate the two records. This is why I never thought of manually adjust the height. Yes, it's working now. Can't believe that was my issue.
Can you explain this?
SUM(AGGR(SUM(Amt), Year, SalesRep))
I see you prefixed with another SUM(). What does this do?
- Mark as New
- Bookmark
- Subscribe
- Mute
- Subscribe to RSS Feed
- Permalink
- Report Inappropriate Content
Aggr() function creates a imaginary table which might have multiple values. If you don't add any function, the expression might result in a null (unless there is only one value to display). But by adding Sum(Aggr()) or Max(Aggr()) you are consolidating the array of values into one value which can then be displayed by the expression.
- Mark as New
- Bookmark
- Subscribe
- Mute
- Subscribe to RSS Feed
- Permalink
- Report Inappropriate Content
Thank you Sunny and swuehl.
I have another question. I want to place a label called "Sales Total" underneath "Year". I looked through the different tabs and attributes already.
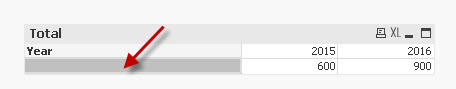
I labeled my expression to say "Sales Total" but it's not showing up.
- Mark as New
- Bookmark
- Subscribe
- Mute
- Subscribe to RSS Feed
- Permalink
- Report Inappropriate Content
May be place a transparent text box object on top of the chart:
- Mark as New
- Bookmark
- Subscribe
- Mute
- Subscribe to RSS Feed
- Permalink
- Report Inappropriate Content
Sunny, that's a smart idea. But is it possible to make that label as part of the chart itself?
- Mark as New
- Bookmark
- Subscribe
- Mute
- Subscribe to RSS Feed
- Permalink
- Report Inappropriate Content
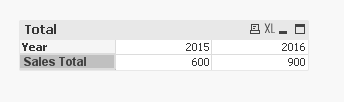
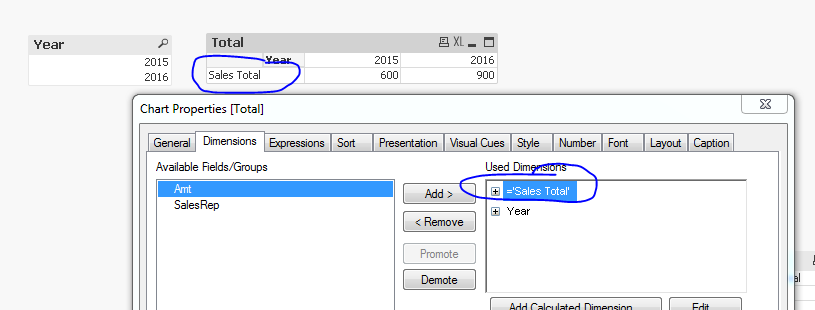
I guess this is another option where you add a string as a dimension
- Mark as New
- Bookmark
- Subscribe
- Mute
- Subscribe to RSS Feed
- Permalink
- Report Inappropriate Content
Or just use a straight table chart with horizontal layout set on presentation tab.
- « Previous Replies
- Next Replies »