Unlock a world of possibilities! Login now and discover the exclusive benefits awaiting you.
- Qlik Community
- :
- All Forums
- :
- QlikView App Dev
- :
- Above Function
- Subscribe to RSS Feed
- Mark Topic as New
- Mark Topic as Read
- Float this Topic for Current User
- Bookmark
- Subscribe
- Mute
- Printer Friendly Page
- Mark as New
- Bookmark
- Subscribe
- Mute
- Subscribe to RSS Feed
- Permalink
- Report Inappropriate Content
Above Function
Hello,
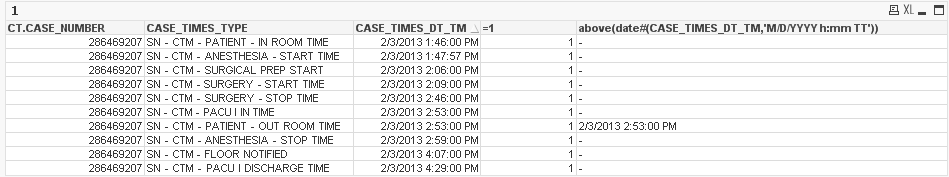
I'm trying to show build the chart below using a straight table and thought it would be an easy Above() call.

I cannot seem to get the 'Time of Row Above' column to calculate correctly. This is what I currently have:
Can anyone help me with this issue?
Thank you!
- « Previous Replies
-
- 1
- 2
- Next Replies »
- Mark as New
- Bookmark
- Subscribe
- Mute
- Subscribe to RSS Feed
- Permalink
- Report Inappropriate Content
Hello,
Assuming that for each CT.CASE_NUMBER and CASE_TIMES_TYPE your dataset has unique CASE_TIMES_DT_TM. then use the following
code first expression as =Only(CASE_TIMES_DT_TM)
second Expression= Above(total aggr(Only(CASE_TIMES_DT_TM),CT.CASE_NUMBER,CASE_TIMES_TYPE ) ,1)
if you have multiple timestamp for Case_Number & Case_TIMES_TYPE then use aggregation function in the first expression, something like max(CASE_TIMES_DT_TM)
- « Previous Replies
-
- 1
- 2
- Next Replies »