Unlock a world of possibilities! Login now and discover the exclusive benefits awaiting you.
- Qlik Community
- :
- All Forums
- :
- QlikView App Dev
- :
- Accumulate quarters - stacked charts
- Subscribe to RSS Feed
- Mark Topic as New
- Mark Topic as Read
- Float this Topic for Current User
- Bookmark
- Subscribe
- Mute
- Printer Friendly Page
- Mark as New
- Bookmark
- Subscribe
- Mute
- Subscribe to RSS Feed
- Permalink
- Report Inappropriate Content
Accumulate quarters - stacked charts
Hi Guys
I want to accumulate everything in sales, say last 8 quarters, but in the chart I only want to show the last four and stacked together showing Product A and Product B.
I have Date field in Month, Year, QuarterYear
Regards
- « Previous Replies
-
- 1
- 2
- Next Replies »
- Mark as New
- Bookmark
- Subscribe
- Mute
- Subscribe to RSS Feed
- Permalink
- Report Inappropriate Content
Nearly there with my version, what if I only want to show the last 3 quarters, but still calculating all four?
Thanks for your help, we are nearly there.
- Mark as New
- Bookmark
- Subscribe
- Mute
- Subscribe to RSS Feed
- Permalink
- Report Inappropriate Content
Just use a variable to make what you want 
Here take a look at my improved solution.
Regards,
MB
- Mark as New
- Bookmark
- Subscribe
- Mute
- Subscribe to RSS Feed
- Permalink
- Report Inappropriate Content
Thanks, haven't tested yet, will let you know how I got on soon.
- Mark as New
- Bookmark
- Subscribe
- Mute
- Subscribe to RSS Feed
- Permalink
- Report Inappropriate Content
 Hi,
Hi,
Nearly there.
In the expression where you had -3, I changed it to -18 to give me the correct figures I was looking for. But I don't want -18 to be hardcoded, i'll need a variable that will count the months, I'm not sure how to do that, I hope you do .
Thanks
sum({<Date={">=$(=Date(Addmonths(max(Date),-18*$(vLastQuarter))))"}>} Sales)
********************* Don't worry I've sorted this bit, easier than I thought, nearly there.
- Mark as New
- Bookmark
- Subscribe
- Mute
- Subscribe to RSS Feed
- Permalink
- Report Inappropriate Content
Hey again,
Do a variable like this:
vMonth = Count(Month) -> this gave me this result:
Then in expression make it like this:
sum({<Date={">=$(=Date(Addmonths(max(Date),-$(vMonth)*$(vLastQuarter))))"}>} Sales)
Hope this helps you get your final solution
Glad to help
Regards,
MB
EDIT: See the attached file bellow...
- Mark as New
- Bookmark
- Subscribe
- Mute
- Subscribe to RSS Feed
- Permalink
- Report Inappropriate Content
Yeah, you missed the bottom of the message, I managed to do that bit, it works perfect with dummy data, but still not there with the real data. Let me fiddle with it, I'll let you know if I give in.
- Mark as New
- Bookmark
- Subscribe
- Mute
- Subscribe to RSS Feed
- Permalink
- Report Inappropriate Content
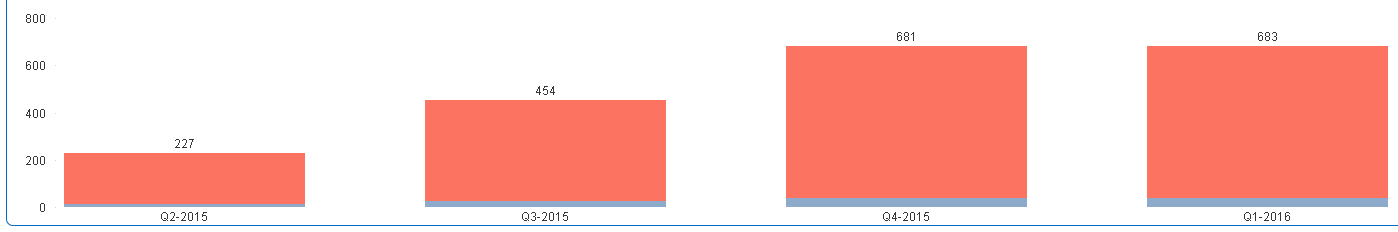
In my real data, this is happening when I take full accumulation off on the expression
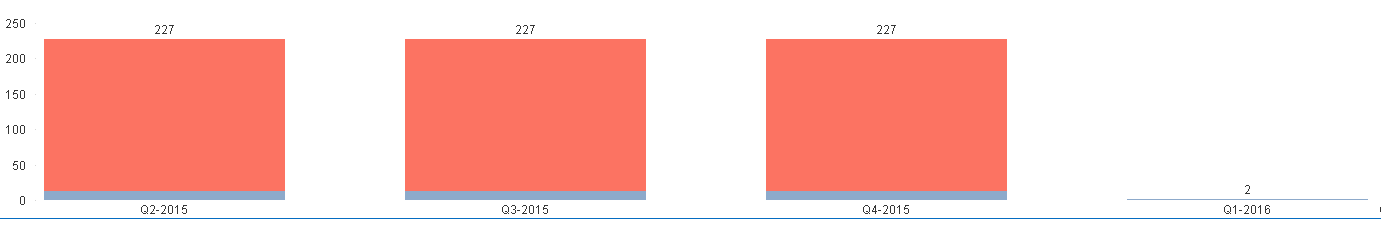
And this is what happens when I have it on, I need q2,3,4 2015 to remain 227 and q1 2016 to say 229
- « Previous Replies
-
- 1
- 2
- Next Replies »