Unlock a world of possibilities! Login now and discover the exclusive benefits awaiting you.
- Qlik Community
- :
- All Forums
- :
- QlikView App Dev
- :
- Accumulation rolling MQT with multiple dimensions
- Subscribe to RSS Feed
- Mark Topic as New
- Mark Topic as Read
- Float this Topic for Current User
- Bookmark
- Subscribe
- Mute
- Printer Friendly Page
- Mark as New
- Bookmark
- Subscribe
- Mute
- Subscribe to RSS Feed
- Permalink
- Report Inappropriate Content
Accumulation rolling MQT with multiple dimensions
Hi All,
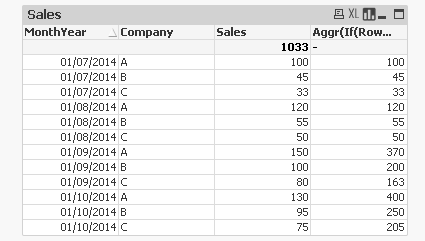
I have a question concerning calculating rolling MQT with multiple dimensions. I have this table with company sales per MonthYear. The Sales column is raw sales. And the Accumulated column is what I want. It adds the sales from the current MonthYear with the sales from the previous 2 MonthYears for that Company (first 2 months should not accumulate, because at least 3 months are needed). How to calculate this properly with an expression in QV (currently I calculated it by hand)?
I checked this link: Calculating rolling n-period totals, averages or other aggregations, but it uses an example with 1 dimension only.
I have tried checking 'Accumulation' with 3 steps back, but this does not seem to work unless I first make a selection of 1 company.
I have tried different combinations of aggr(), rangesum(), above(), TOTAL, rowno(), etc. without success.
| MonthYear | Company | Sales | Accumulated |
|---|---|---|---|
| 01/07/2014 | A | 100 | 100 |
| 01/07/2014 | B | 45 | 45 |
| 01/07/2014 | C | 33 | 33 |
| 01/08/2014 | A | 120 | 120 |
| 01/08/2014 | B | 55 | 55 |
| 01/08/2014 | C | 50 | 50 |
| 01/09/2014 | A | 150 | 370 |
| 01/09/2014 | B | 100 | 200 |
| 01/09/2014 | C | 80 | 163 |
| 01/10/2014 | A | 130 | 400 |
| 01/10/2014 | B | 95 | 250 |
| 01/10/2014 | C | 75 | 205 |
Hope some Qlik colleagues here have the golden tip!
Many thanks 
- Mark as New
- Bookmark
- Subscribe
- Mute
- Subscribe to RSS Feed
- Permalink
- Report Inappropriate Content
How about this?
Aggr(If(RowNo() >= 3, RangeSum(Above(Sum(Sales), 0, 3)), Sum(Sales)), Company, MonthYear)
- Mark as New
- Bookmark
- Subscribe
- Mute
- Subscribe to RSS Feed
- Permalink
- Report Inappropriate Content
Hi Sunny,
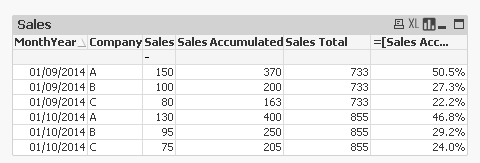
Thanks for that input . It worked fine. Now I used the same trick for totals to get percentages.
Any idea for how to get rid of the MonthYear 01/07/2014 and 01/08/2014 in the graph to not confuse people that those are also MQT values?
Best,
Neal
- Mark as New
- Bookmark
- Subscribe
- Mute
- Subscribe to RSS Feed
- Permalink
- Report Inappropriate Content
Would you able to share the expected output for percentages and how it should look once you remove MonthYear in table form (just like you did in your initial post)?
- Mark as New
- Bookmark
- Subscribe
- Mute
- Subscribe to RSS Feed
- Permalink
- Report Inappropriate Content
So I already calculated percentages the way I need them. But now I want the 'Bolded' rows to dissapear because they only contain data for 1 or 2 months. While I need only the rows where 3 months are accumulated.
In dimension limitations tab there is an option to show first x values, but not last x values. Or enable conditional perhaps, or a calculated dimension. In the background the data should still be there, but only those MonthYears with at least 2 before them should be shown. Any ideas?
| MonthYear | Company | Sales | Sales Accumulated | Sales Total MY | Total Sales Acc | Final % |
|---|---|---|---|---|---|---|
| 1033 | 1033 | |||||
| 01/07/2014 | A | 100 | 100 | 178 | 178 | 56% |
| 01/07/2014 | B | 45 | 45 | 178 | 178 | 25% |
| 01/07/2014 | C | 33 | 33 | 178 | 178 | 19% |
| 01/08/2014 | A | 120 | 220 | 225 | 403 | 55% |
| 01/08/2014 | B | 55 | 100 | 225 | 403 | 25% |
| 01/08/2014 | C | 50 | 83 | 225 | 403 | 21% |
| 01/09/2014 | A | 150 | 370 | 330 | 733 | 50% |
| 01/09/2014 | B | 100 | 200 | 330 | 733 | 27% |
| 01/09/2014 | C | 80 | 163 | 330 | 733 | 22% |
| 01/10/2014 | A | 130 | 400 | 300 | 855 | 47% |
| 01/10/2014 | B | 95 | 250 | 300 | 855 | 29% |
| 01/10/2014 | C | 75 | 205 | 300 | 855 | 24% |
- Mark as New
- Bookmark
- Subscribe
- Mute
- Subscribe to RSS Feed
- Permalink
- Report Inappropriate Content
This?
- Mark as New
- Bookmark
- Subscribe
- Mute
- Subscribe to RSS Feed
- Permalink
- Report Inappropriate Content
Hi Sunny,
Yes that was the solution I also found. By just using an if statement in the expression the first 2 months can be excluded from the graph. Thanks for your help!
Neal
- Mark as New
- Bookmark
- Subscribe
- Mute
- Subscribe to RSS Feed
- Permalink
- Report Inappropriate Content
No problem Neal
Best,
Sunny