Unlock a world of possibilities! Login now and discover the exclusive benefits awaiting you.
- Qlik Community
- :
- All Forums
- :
- QlikView App Dev
- :
- Activate other graphic tabel with a value from a c...
- Subscribe to RSS Feed
- Mark Topic as New
- Mark Topic as Read
- Float this Topic for Current User
- Bookmark
- Subscribe
- Mute
- Printer Friendly Page
- Mark as New
- Bookmark
- Subscribe
- Mute
- Subscribe to RSS Feed
- Permalink
- Report Inappropriate Content
Activate other graphic tabel with a value from a certain table
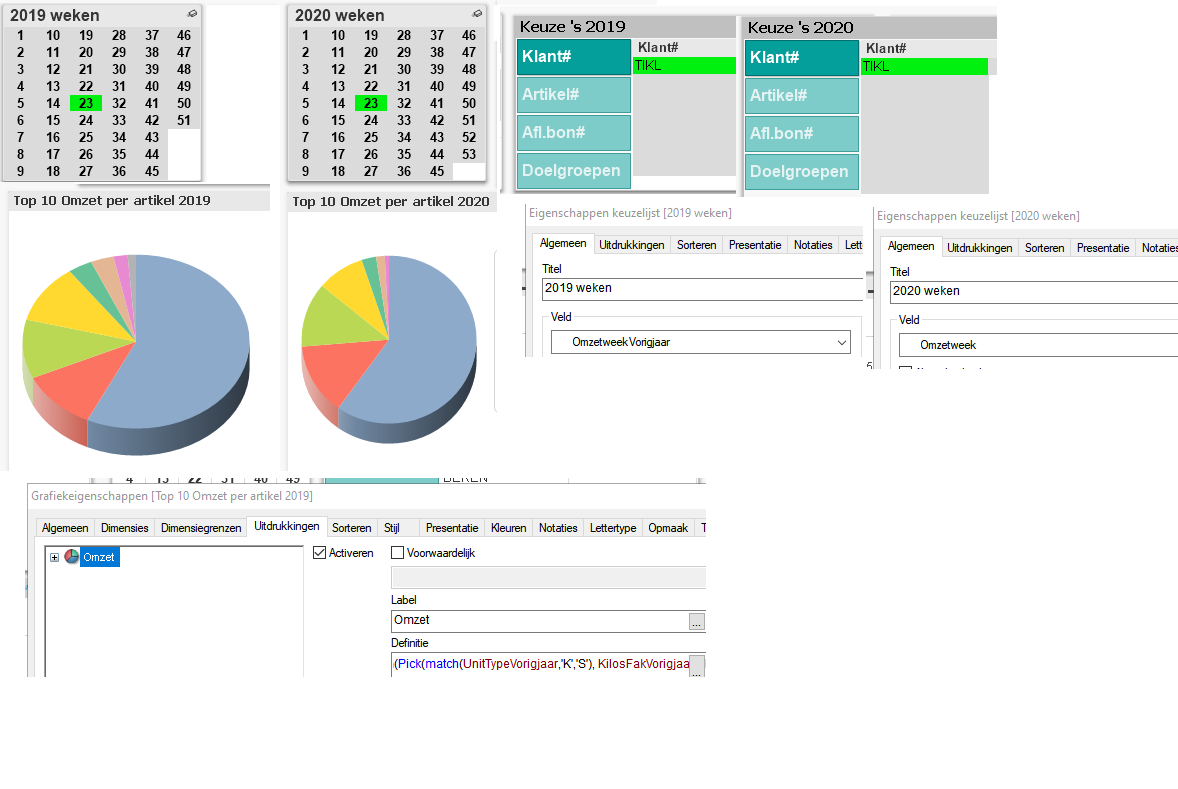
please look at sample
having 2 sales years , from separate data tables, now when i want to compare in 2019 and 2020 the same week(s) and/or same customer i must double click in both weeks and/of customer graphs
e.a. week 23 in 2019 i must then also clicked in 2020 week 23 same story with customer choices
how to ativate a script thats activates same week(s) cliked in 2019 to 2020 ?
Thanks for advise
this is in grafics statement
OMZET BASED ON IN 2019
sum(Pick(match(UnitTypeVorigjaar,'K','S'), KilosFakVorigjaar * PrijsFakVorigjaar, StuksFakVorigjaar * PrijsFakVorigjaar))
OMZET BASED ON IN 2020
sum(Pick(match(UnitType,'K','S'), KilosFak * PrijsFak, StuksFak * PrijsFak))
- Tags:
- qlikview_scripting
Accepted Solutions
- Mark as New
- Bookmark
- Subscribe
- Mute
- Subscribe to RSS Feed
- Permalink
- Report Inappropriate Content
I would suggest to make single week for all years and then define chart like this for different years?
Pie Chart:
Dimension : Year
Expressions are
OMZET BASED ON IN 2019
sum(Pick(match(UnitTypeVorigjaar,'K','S'), KilosFakVorigjaar * PrijsFakVorigjaar, StuksFakVorigjaar * PrijsFakVorigjaar))
OMZET BASED ON IN 2020
sum(Pick(match(UnitType,'K','S'), KilosFak * PrijsFak, StuksFak * PrijsFak))
- Mark as New
- Bookmark
- Subscribe
- Mute
- Subscribe to RSS Feed
- Permalink
- Report Inappropriate Content
Still you need separate, Create 2 week fileds and 2 pie charts then assign for 1+1 filter and graph as alternate states to work this Here
- Mark as New
- Bookmark
- Subscribe
- Mute
- Subscribe to RSS Feed
- Permalink
- Report Inappropriate Content
I would suggest to make single week for all years and then define chart like this for different years?
Pie Chart:
Dimension : Year
Expressions are
OMZET BASED ON IN 2019
sum(Pick(match(UnitTypeVorigjaar,'K','S'), KilosFakVorigjaar * PrijsFakVorigjaar, StuksFakVorigjaar * PrijsFakVorigjaar))
OMZET BASED ON IN 2020
sum(Pick(match(UnitType,'K','S'), KilosFak * PrijsFak, StuksFak * PrijsFak))
- Mark as New
- Bookmark
- Subscribe
- Mute
- Subscribe to RSS Feed
- Permalink
- Report Inappropriate Content
true, but some practical problems in table by source , (Pervasive based ) that why we must stay to separate tables per year
thanks anyway
- Mark as New
- Bookmark
- Subscribe
- Mute
- Subscribe to RSS Feed
- Permalink
- Report Inappropriate Content
Still you need separate, Create 2 week fileds and 2 pie charts then assign for 1+1 filter and graph as alternate states to work this Here
- Mark as New
- Bookmark
- Subscribe
- Mute
- Subscribe to RSS Feed
- Permalink
- Report Inappropriate Content
during load did connection to 2019 and 2020 table like:
AflKlant as Klantnummer, <<<<<<<<
AflArtNum as Plunr,
AflFlag as Status,
AflbonNummer as Leverbonnummer,
AflAflDate as Leverdatum,
week(Right(AflAflDate,2)&'-'& mid(AflAflDate,3,2)&'-'& left(AflAflDate,2)) as Omzetweek,<<<<<
month(Right(AflAflDate,2)&'-'& mid(AflAflDate,3,2)&'-'& left(AflAflDate,2)) as Omzetmaand,
Date#(Right(AflAflDate,2)&'-'& mid(AflAflDate,3,2)&'-20'& left(AflAflDate,2)) as OmzetDatum,
week(Right(AflAflDate,2)&'-'& mid(AflAflDate,3,2)&'-'& left(AflAflDate,2)) as OmzetweekVorigjaar, <<<<
AflKlant as KlantnummerVorigjaar, <<<<<<<<<<
AflKilos as KilosFak,