Unlock a world of possibilities! Login now and discover the exclusive benefits awaiting you.
- Qlik Community
- :
- All Forums
- :
- QlikView App Dev
- :
- Add Multiple Total Column at the end of Each Fisca...
- Subscribe to RSS Feed
- Mark Topic as New
- Mark Topic as Read
- Float this Topic for Current User
- Bookmark
- Subscribe
- Mute
- Printer Friendly Page
- Mark as New
- Bookmark
- Subscribe
- Mute
- Subscribe to RSS Feed
- Permalink
- Report Inappropriate Content
Add Multiple Total Column at the end of Each Fiscal year
I have three Dimension: Country, State, Month-Year and two Measures Quantity, Price.
i have used Pivot Table in QlikView to Show Country & State, For Month i have dragged above expression so that each Month-Year gets added it shows as another Column, Below Month-Year i will be showing Quantity , Price. this what i have already achieved.
My Query is that now i want to add three More Columns (YTD Volume, YTD Value, YTD Contribution) at the end of each Fiscal Year. which means Quantity & Price will keep repeating for each Month year. and the new three columns (YTD Volume, YTD Value, YTD Contribution) should be displayed at the end of each Fiscal year.
How is it possible?
i have attached sample of what i am expecting the table to look like
Accepted Solutions
- Mark as New
- Bookmark
- Subscribe
- Mute
- Subscribe to RSS Feed
- Permalink
- Report Inappropriate Content
Hi Viv,
In your script you add a data island table 'Dimension':
RawData:
CrossTable(Date, Data, 3)
LOAD Country,
State,
City,
[42461],
[42491],
[42522],
[42826],
[42856],
[42887]
FROM
TestPivot.xlsx
(ooxml, embedded labels, table is Tabelle1);
NoConcatenate
Final:
LOAD
Country,
State,
City,
Year(Num#(Date, '#####')) as Year,
Date(Num#(Date, '#####'), 'MMM YY') as MonthYear,
Data as Volume
Resident RawData
;
DROP Table RawData;
Dimension:
LOAD * INLINE [
Dim
1
2
3
];
After reload you can build your pivot table like this:
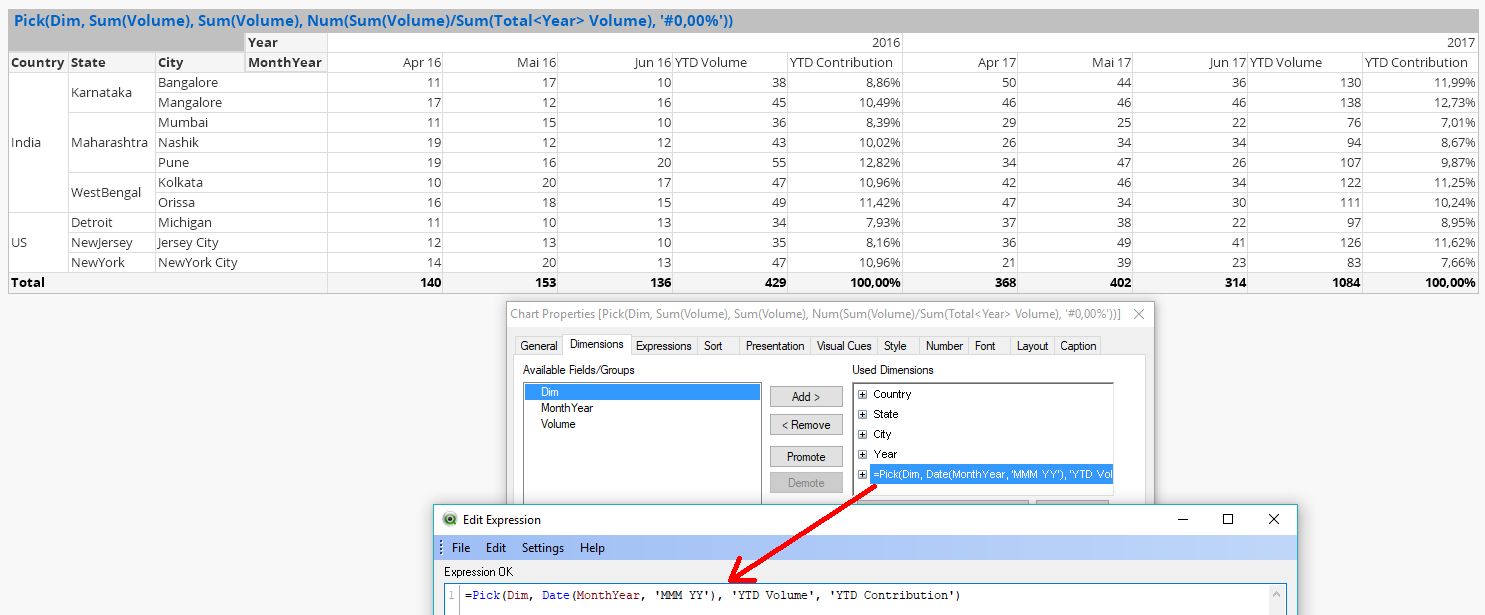
The trick is to use a calculated dimension with Pick and Dim and also the Expression (you can find it in the caption of
the pivot table)
Hope this helps
Burkhard
- Mark as New
- Bookmark
- Subscribe
- Mute
- Subscribe to RSS Feed
- Permalink
- Report Inappropriate Content
Hi Viv,
In your script you add a data island table 'Dimension':
RawData:
CrossTable(Date, Data, 3)
LOAD Country,
State,
City,
[42461],
[42491],
[42522],
[42826],
[42856],
[42887]
FROM
TestPivot.xlsx
(ooxml, embedded labels, table is Tabelle1);
NoConcatenate
Final:
LOAD
Country,
State,
City,
Year(Num#(Date, '#####')) as Year,
Date(Num#(Date, '#####'), 'MMM YY') as MonthYear,
Data as Volume
Resident RawData
;
DROP Table RawData;
Dimension:
LOAD * INLINE [
Dim
1
2
3
];
After reload you can build your pivot table like this:
The trick is to use a calculated dimension with Pick and Dim and also the Expression (you can find it in the caption of
the pivot table)
Hope this helps
Burkhard
- Mark as New
- Bookmark
- Subscribe
- Mute
- Subscribe to RSS Feed
- Permalink
- Report Inappropriate Content
You are simple aesome 
Thank you
- Mark as New
- Bookmark
- Subscribe
- Mute
- Subscribe to RSS Feed
- Permalink
- Report Inappropriate Content
i meant *awesome*