Unlock a world of possibilities! Login now and discover the exclusive benefits awaiting you.
- Qlik Community
- :
- All Forums
- :
- QlikView App Dev
- :
- Re: Add a calculated column to pivot table with se...
- Subscribe to RSS Feed
- Mark Topic as New
- Mark Topic as Read
- Float this Topic for Current User
- Bookmark
- Subscribe
- Mute
- Printer Friendly Page
- Mark as New
- Bookmark
- Subscribe
- Mute
- Subscribe to RSS Feed
- Permalink
- Report Inappropriate Content
Add a calculated column to pivot table with set analysis
I'm struggling to solve a problem with a pivot table.
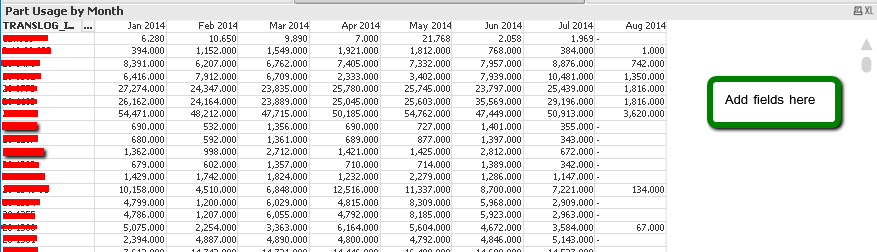
My user would like a pivot table that shows usage for each part by month - with the month name/year as the column headers.
My current pivot table consists of 2 dimensions, and 1 expression:
Dimensions:
Transaction Item #
MonthName(Transaction Date)
Expression:
Sum(Transaction Qty)
I think pivot the table so the MonthName are as headers.
At the end of the columns, they'd like me to add 5 fields:
- Last 3 months usage average,
- Last 6 months usage average
- Current On-Hand
- Current On Hand / Last 3 Months Usage
- Current On Hand / Last 6 Months Usage
I cannot conceive how to do this with the pivot table.
Accepted Solutions
- Mark as New
- Bookmark
- Subscribe
- Mute
- Subscribe to RSS Feed
- Permalink
- Report Inappropriate Content
Hi,
I don't think it's possible in the same pivot table, I use another table (Satraigth table) with 1 dimension: Transaction Item # and 5 expressions:
1st: Last 3 Months usage Average
Sum({<Period = {'>=$(=MonthName(AddMonths(Max([Transaction Date]),-2)))'}>} [Transaction Qty]) / 3
2nd: Last 6 Months usage Average
Sum({<Period = {'>=$(=MonthName(AddMonths(Max([Transaction Date]),-5)))'}>} [Transaction Qty]) / 6
3rd: Current HandOn
Sum({$<Month = {$(#=Max(Month))}>}[Transaction Qty])
4th: Current HandOn / Last 3 months usage average
Column(3) / Column(1)
5th: Current HandOn / Last 6 months usage average
Column(3) / Column(2)
Best regards
- Mark as New
- Bookmark
- Subscribe
- Mute
- Subscribe to RSS Feed
- Permalink
- Report Inappropriate Content
Any ideas?
- Mark as New
- Bookmark
- Subscribe
- Mute
- Subscribe to RSS Feed
- Permalink
- Report Inappropriate Content
Hi Joe,
You could add another pivot table on the right side with your new calculations.
Or you could add a dummy (inline in script) dimension (let say "Calc_Group" containing 1 for months, 2 for "Last 3 months usage average") and move that dimension in column (over your months) and add in your set analysis {$<Calc_Group={1}>} for your formulas for months and {$<Calc_Group={2}>} for your formulas for "Last 3 months usage average" and so on...
You will have to use a pick match in you formulas for this to work too, like in that post :
Execute Set Analysis stored in a table
http://community.qlik.com/servlet/JiveServlet/download/144592-21279/testTableDrivenCalculations5.qvw
If your dimension Calc_Group = 2 then it will pick the formula for "Last 3 months usage average".
Patrick
- Mark as New
- Bookmark
- Subscribe
- Mute
- Subscribe to RSS Feed
- Permalink
- Report Inappropriate Content
Hi,
I don't think it's possible in the same pivot table, I use another table (Satraigth table) with 1 dimension: Transaction Item # and 5 expressions:
1st: Last 3 Months usage Average
Sum({<Period = {'>=$(=MonthName(AddMonths(Max([Transaction Date]),-2)))'}>} [Transaction Qty]) / 3
2nd: Last 6 Months usage Average
Sum({<Period = {'>=$(=MonthName(AddMonths(Max([Transaction Date]),-5)))'}>} [Transaction Qty]) / 6
3rd: Current HandOn
Sum({$<Month = {$(#=Max(Month))}>}[Transaction Qty])
4th: Current HandOn / Last 3 months usage average
Column(3) / Column(1)
5th: Current HandOn / Last 6 months usage average
Column(3) / Column(2)
Best regards
- Mark as New
- Bookmark
- Subscribe
- Mute
- Subscribe to RSS Feed
- Permalink
- Report Inappropriate Content
Hi Joe,
Yes it works, here is a modified sample to show you how!
Patrick
- Mark as New
- Bookmark
- Subscribe
- Mute
- Subscribe to RSS Feed
- Permalink
- Report Inappropriate Content
Thank you very much - I will give this a try and get back to you soon!