Unlock a world of possibilities! Login now and discover the exclusive benefits awaiting you.
- Qlik Community
- :
- All Forums
- :
- QlikView App Dev
- :
- Add a sum bottom line to a pivot table chart
- Subscribe to RSS Feed
- Mark Topic as New
- Mark Topic as Read
- Float this Topic for Current User
- Bookmark
- Subscribe
- Mute
- Printer Friendly Page
- Mark as New
- Bookmark
- Subscribe
- Mute
- Subscribe to RSS Feed
- Permalink
- Report Inappropriate Content
Add a sum bottom line to a pivot table chart
Hi,
I created a simple webanalytics pivot table chart whose structure is :
Dimension :
Metrics :
As a result when i select year 2006 for example (yeah thos are totally fake data) :
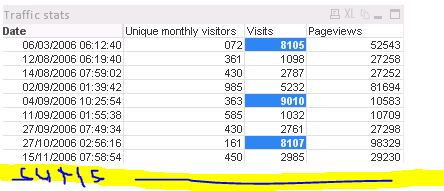
I'd like to add a bottom line wich sum metrics wich remain visibles for dates selected, just like the yellow line added on my screenshot (dates are selected from a calendar.)
Could you help me ?
Thank you so much
- Mark as New
- Bookmark
- Subscribe
- Mute
- Subscribe to RSS Feed
- Permalink
- Report Inappropriate Content
go t presentation and check on partial sum
and seleect there sub total on bottom
it may give u desired result.
Thanks
sunil Chauhan
- Mark as New
- Bookmark
- Subscribe
- Mute
- Subscribe to RSS Feed
- Permalink
- Report Inappropriate Content
actually it works but only when some line is selected into the table.
i'd like to display total even when users didn't selected anything, is it possible ?
- Mark as New
- Bookmark
- Subscribe
- Mute
- Subscribe to RSS Feed
- Permalink
- Report Inappropriate Content
can u share some sample
- Mark as New
- Bookmark
- Subscribe
- Mute
- Subscribe to RSS Feed
- Permalink
- Report Inappropriate Content
Hello,
If you set the subtotal on top it behaves the same showing only when you click? Have you set any conditional in the totals? Are you using a pivot or a straight (obvious perhaps, but they may work different)?
Regards.
BI Consultant
- Mark as New
- Bookmark
- Subscribe
- Mute
- Subscribe to RSS Feed
- Permalink
- Report Inappropriate Content
Hello,
I'm using a pivot table.
When i switch from "Subtotals at bottom" to "Subtotals on top", there is no differences.
What i'd like is a permanent totals line at the bottom of my table.
Do you think i shoud try with a straight table ?
- Mark as New
- Bookmark
- Subscribe
- Mute
- Subscribe to RSS Feed
- Permalink
- Report Inappropriate Content
thank you, i found a way (addind another table.)
- Mark as New
- Bookmark
- Subscribe
- Mute
- Subscribe to RSS Feed
- Permalink
- Report Inappropriate Content
Hi,
Nope, that should work regardless the type of chart. A straight table makes more sense when the chart will display all information for every possible value in dimension, as opposed to the pivot, that you can expand and collapse (say year, month, date) and pivot dimensions and expressions horizontal to vertical and viceversa.
But it sounds very strange that the partial sums line only shows up when some selections are done... Does that happen when they view the chart in the Desktop application, AJAX, plugin? What if the chart shows a small number of rows? Does the total row shows up? Or is that they have to scroll down and for some reason the scroll bar is not visible?
Check the attached application. I've set the partial sums row at top, but you don't need to select any value to get the totals.
Hope that helps.
BI Consultant
- Mark as New
- Bookmark
- Subscribe
- Mute
- Subscribe to RSS Feed
- Permalink
- Report Inappropriate Content
Hi Sabrina ,
This is my offer, pls to see image adjust
Good luck, Luis.