Unlock a world of possibilities! Login now and discover the exclusive benefits awaiting you.
- Qlik Community
- :
- All Forums
- :
- QlikView App Dev
- :
- Add coloumn in row
- Subscribe to RSS Feed
- Mark Topic as New
- Mark Topic as Read
- Float this Topic for Current User
- Bookmark
- Subscribe
- Mute
- Printer Friendly Page
- Mark as New
- Bookmark
- Subscribe
- Mute
- Subscribe to RSS Feed
- Permalink
- Report Inappropriate Content
Add coloumn in row
Hi Team,
I Have a data like this.
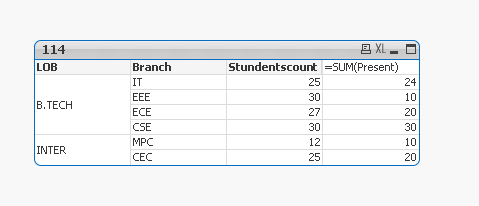
I want to add two additional rows into each LOB like Total and %.Please find below image.
.PNG)
In total 0.66 menas 66%
0.81 means 81%
- « Previous Replies
-
- 1
- 2
- Next Replies »
- Mark as New
- Bookmark
- Subscribe
- Mute
- Subscribe to RSS Feed
- Permalink
- Report Inappropriate Content
Thanks Mnaish
I will Try
- Mark as New
- Bookmark
- Subscribe
- Mute
- Subscribe to RSS Feed
- Permalink
- Report Inappropriate Content
Hi
A bit of a workaround by calculating the percentage present at LOB level in the script and then utilising dimensionality in the chart expression.
data:
load * inline [
LOB,Branch,Students,Present
B.TECH,IT,25,24
B.TECH,EEE,30,10
B.TECH,ECE,27,20
B.TECH,CSE,30,30
];
test:
load LOB,
num(sum(Present)/sum(Students),'##0.00%')as %present
resident data
group by LOB;
left join(data)
load *
resident test;
drop table test;
Then in a pivot table use LOB and branch as dimensions with just sum(students) and sum(present) as expressions and tick the show partial sums on the presentation tab to get the totals. Finally the expression for the percentage is =if(dimensionality()=0,only(%present))
It's not quite in the format you wanted but hopefully it may be useful for you.
- Mark as New
- Bookmark
- Subscribe
- Mute
- Subscribe to RSS Feed
- Permalink
- Report Inappropriate Content
Its working fine
Thnak you somuch
- « Previous Replies
-
- 1
- 2
- Next Replies »