Unlock a world of possibilities! Login now and discover the exclusive benefits awaiting you.
- Qlik Community
- :
- All Forums
- :
- QlikView App Dev
- :
- Adding A TextBox
- Subscribe to RSS Feed
- Mark Topic as New
- Mark Topic as Read
- Float this Topic for Current User
- Bookmark
- Subscribe
- Mute
- Printer Friendly Page
- Mark as New
- Bookmark
- Subscribe
- Mute
- Subscribe to RSS Feed
- Permalink
- Report Inappropriate Content
Adding A TextBox
Hi Everyone!
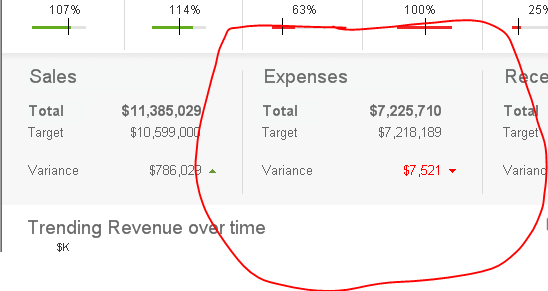
I am pretty new to Qlikview, know the basics, but am unsure how to add a figure similar to this one shown here from the demo:

I feel like this has to be multiple text boxes put together, however I'm not sure how to get this format.
Thanks for the help!
-Alex
- Mark as New
- Bookmark
- Subscribe
- Mute
- Subscribe to RSS Feed
- Permalink
- Report Inappropriate Content
This are text boxes and Text use as Image also multiple combination for more information if you are using the Qlikview 11.0 you can find the samples in the Expence Management example in Dashboard sheet.
- Mark as New
- Bookmark
- Subscribe
- Mute
- Subscribe to RSS Feed
- Permalink
- Report Inappropriate Content
Hi Alex,
It looks like there are 7 text boxes being used in your example (4 boxes with static text, 3 boxes with calculations). To replicate this look, make the background of each text box transparent, and make sure they are layered above the background image. To get the dynamic red color, go to the properties of the text object, click the font tab, click the color box, and select calculated for the base color. From here, you can create an IF statement to have multiple colors available based on the value.
Example:
=IF(Sum([Expenses])>1000, Red(), Green())