Unlock a world of possibilities! Login now and discover the exclusive benefits awaiting you.
- Qlik Community
- :
- All Forums
- :
- QlikView App Dev
- :
- Re: Adding Trendline with value 99%
- Subscribe to RSS Feed
- Mark Topic as New
- Mark Topic as Read
- Float this Topic for Current User
- Bookmark
- Subscribe
- Mute
- Printer Friendly Page
- Mark as New
- Bookmark
- Subscribe
- Mute
- Subscribe to RSS Feed
- Permalink
- Report Inappropriate Content
Adding Trendline with value 99%
Hello everbody,
I've been browsing through the questions about creating trendlines and find it difficult to implenment into my example.
Does someone have any idea on how I can add a trendline in the Bar_chart where the value should of the trendline is always 99% ?
If the data results drops below 99% it should be marked in red, if its 99% or higher it should be marked in green.
I've added a simple testfile so it's easyer to follow what I mean.
I hope anyone can help me please.
Kind regards,
Monique
- Tags:
- new_to_qlikview
- « Previous Replies
-
- 1
- 2
- Next Replies »
Accepted Solutions
- Mark as New
- Bookmark
- Subscribe
- Mute
- Subscribe to RSS Feed
- Permalink
- Report Inappropriate Content
Monuque,
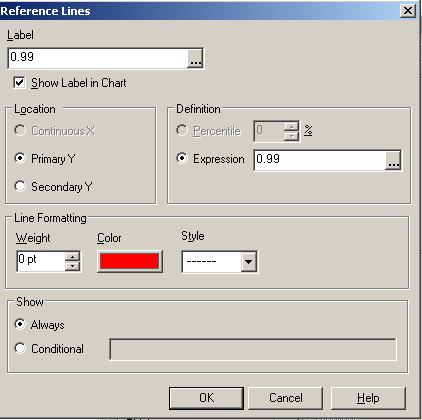
If it is a fixed value (99%), what you need is not a trend line but a reference line. See Presentation tab. Define expression for your line as 0.99.
Regards,
Michael
- Mark as New
- Bookmark
- Subscribe
- Mute
- Subscribe to RSS Feed
- Permalink
- Report Inappropriate Content
Monuque,
If it is a fixed value (99%), what you need is not a trend line but a reference line. See Presentation tab. Define expression for your line as 0.99.
Regards,
Michael
- Mark as New
- Bookmark
- Subscribe
- Mute
- Subscribe to RSS Feed
- Permalink
- Report Inappropriate Content
do you mean reference line, like that?
- Mark as New
- Bookmark
- Subscribe
- Mute
- Subscribe to RSS Feed
- Permalink
- Report Inappropriate Content
Yes indeed
- Mark as New
- Bookmark
- Subscribe
- Mute
- Subscribe to RSS Feed
- Permalink
- Report Inappropriate Content
Massimo,
Can you tell me how you did that please? I've been there to try it but I'm stuck on how to create the expression for the trendline.
- Mark as New
- Bookmark
- Subscribe
- Mute
- Subscribe to RSS Feed
- Permalink
- Report Inappropriate Content
apply Michael answer to get a chart as my image
- Mark as New
- Bookmark
- Subscribe
- Mute
- Subscribe to RSS Feed
- Permalink
- Report Inappropriate Content
this is the reference line in my previous post image
- Mark as New
- Bookmark
- Subscribe
- Mute
- Subscribe to RSS Feed
- Permalink
- Report Inappropriate Content
Hello Michael,
I've found it but I notice that the trendline stays on the 100%, I would like it to be on the 99% value.
Because it so close to the 100% I tried to set the reference line on 0.90 and the trendline stayed on the 100%
So this is not exactly what I want  Sorry
Sorry
- Mark as New
- Bookmark
- Subscribe
- Mute
- Subscribe to RSS Feed
- Permalink
- Report Inappropriate Content
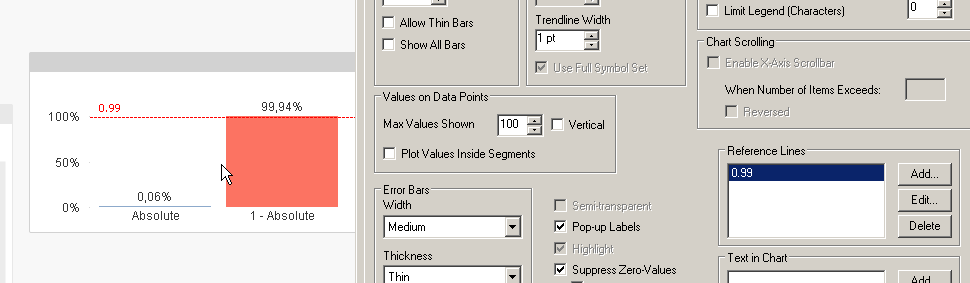
See attached.
If you make your chart large enough, it is easy to see that the line is below 99.94%. Not 100% for sure.
- Mark as New
- Bookmark
- Subscribe
- Mute
- Subscribe to RSS Feed
- Permalink
- Report Inappropriate Content
You are absolutly wright, thank u so much.
- « Previous Replies
-
- 1
- 2
- Next Replies »